
Interval Estimation
Lecture 19
So far
- Estimation: “our best guess”
- Interpretation
- Rinse and Repeat
- But what about those error bars? What about those extra columns in our output tables?
Our goal: quantify uncertainty to help make informed decisions
- What kind of uncertainty?
- How do you quantify it?
- These are surprisingly spicy and controversial questions in statistics!
- With the short time remaining, we will focus on quantifying one specific type of uncertainty…
Classical sampling uncertainty
But first a message from the Capitol

The Reaping
- Suppose that my 199 class is the population of interest
- Each of you will take a sample of 3, and compute the mean
- Do you all expect to get the same value?
- May the odds be ever in your favor
- What if we increased the sample size?
Sampling uncertainty
Different data give different estimates. How different?
- In reality, we have one (sample) dataset, and it gives one set of results. How reliable are those results?
- A thought experiment: if I collected a whole new dataset and redid my analysis, do I get the same results, or different results?
- if the results vary wildly from dataset to dataset, uncertainty is high and reliability is low;
- if the results are stable from one dataset to another, uncertainty is low and reliability is high.
That’s the main idea in a nutshell.
A running example
The openintro::loans_full_schema data frame contains loan data from the peer-to-peer lender, Lending Club, available in the openintro package.
10000 rows;
each row is an approved loan applicant;
-
the columns contain financial info about the loan applicant, including…
- annual income (in $);
- amount of non-mortgage debt outstanding (in $).
What would you guess is the direction of association between these two variables?
Model fit with five observations
(I just took logs to make the picture prettier.)
Double the sample size

Double the sample size again

Double the sample size again

Double the sample size again

Double the sample size again

Double the sample size again

Double the sample size again

Double the sample size again

Double the sample size yet again

Double the sample size one more time

Use all the data we have

What did we notice?
As the sample size grew, the best fit line stabilized;
As the sample size grew, the grey uncertainty band shrank;
As the sample size grew, we observed a larger range of income values, and the computer displayed more of the line;
-
As the sample size grows, the picture the data paint becomes clearer:
- positive relationship;
- linear relationship;
- pretty strong
A silly question
Which would you rather have for your data analysis? 5 people in your dataset or 9947? Why?
Here’s the deal
We do not know what the “true” line is;
Our estimates are a best guess based on noisy, incomplete, imperfect data;
The more data we have, the more “certain” and “reliable” the estimates are;
What do we mean by “uncertainty” here?
Sampling uncertainty
Fact: different data set \(\rightarrow\) different estimates;
-
How much would our estimate vary across alternative datasets?
- If the answer is “a lot,” uncertainty is high, and our estimates are not super reliable;
- If the answer is “a little,” uncertainty is low, and maybe we can take our estimates to the bank;
Here’s one dataset we could have seen

Here’s another

Here’s yet one more

Different data set \(\rightarrow\) different estimates
These tiny data sets can’t even agree on if the line should slope up or down. Uncertainty is high, hence the large bands.
If we repeat the process with a larger sample size, things are more stable
Alternative 1

Alternative 2

Alternative 3

Let’s visualize how the estimates vary
Different data set \(\rightarrow\) different estimates

# A tibble: 2 × 2
  term        estimate
  <chr>          <dbl>
1 (Intercept)    4.27
2 log_inc        0.553
Different data set \(\rightarrow\) different estimates

# A tibble: 2 × 2
  term        estimate
  <chr>          <dbl>
1 (Intercept)    -4.63
2 log_inc         1.35
Different data set \(\rightarrow\) different estimates

# A tibble: 2 × 2
  term        estimate
  <chr>          <dbl>
1 (Intercept)    -1.14
2 log_inc         1.04
Different data set \(\rightarrow\) different estimates

# A tibble: 2 × 2
  term        estimate
  <chr>          <dbl>
1 (Intercept)   -0.288
2 log_inc        0.960
Different data set \(\rightarrow\) different estimates

# A tibble: 2 × 2
  term        estimate
  <chr>          <dbl>
1 (Intercept)    4.84
2 log_inc        0.492
Different data set \(\rightarrow\) different estimates

# A tibble: 2 × 2
  term        estimate
  <chr>          <dbl>
1 (Intercept)    3.20
2 log_inc        0.654
You get the idea

Variation in estimates across alternative datasets


The amount of variation (i.e., “spread”) in the histogram tells us something about the uncertainty, and gives us a range of likely values.
Summary
- The notion of uncertainty we seek to quantify is “variability of estimates across datasets;”
- If the estimates vary a lot across datasets, reliability is low and uncertainty is high;
- If the estimates vary only a little across datasets, reliability is high and uncertainty is low;
- We can visualizes this with a histogram of estimates, and quantify it with the spread of that histogram (sd, var, IQR, etc);
- Sampling uncertainty is influenced by the underlying noisiness of the data and the sample size.
. . .
In order to do this in practice, we need multiple datasets. But in practice, we only have access to one. So now what?
The bootstrap
Reality check
- Contemplating alternative datasets is a cute thought experiment, but in reality we cannot collect completely new data;
- Data collection is costly!
- Collecting new survey responses;
- Recruiting new subjects;
- Running new experiments;
- Firing up the Large Hadron Collider for one more go;
- Given the one dataset we actually have, how can we approximate the idea of alternative datasets and use them to assess the variability of results?
Bootstrapping
We approximate this idea of “alternative, hypothetical datasets I could have observed” by resampling our data with replacement;
-
We construct a new dataset of the same size by randomly picking rows out of the original one:
- Some rows will be duplicated;
- Some rows will not appear at all;
- Hence, the new dataset is different from the original;
- Different dataset \(\rightarrow\) different estimate;
Repeat this processes hundred or thousands of times, and observe how the estimates vary as you refit the model on these hypothetical alternative datasets;
This gives you a sense of the sampling variability of your estimates.
Bootstrapping

Bootstrapping

Bootstrapping

Bootstrapping

Bootstrapping

Bootstrapping

Bootstrapping

Toy: Bootstrap samples 1
Original data
# A tibble: 6 × 3
     id       x       y
  <int>   <dbl>   <dbl>
1     1  0.432   1.53
2     2 -2.01    1.80
3     3 -0.0467  1.43
4     4 -1.05    0.0518
5     5  0.327   0.820
6     6 -0.679  -0.961
Original estimates:
# A tibble: 2 × 2
  term        estimate
  <chr>          <dbl>
1 (Intercept)   0.801
2 x             0.0450
Sample with replacement:
# A tibble: 6 × 3
     id      x      y
  <int>  <dbl>  <dbl>
1     5  0.327  0.820
2     6 -0.679 -0.961
3     6 -0.679 -0.961
4     1  0.432  1.53
5     6 -0.679 -0.961
6     1  0.432  1.53
Different data \(\rightarrow\) new estimates:
# A tibble: 2 × 2
  term        estimate
  <chr>          <dbl>
1 (Intercept)    0.462
2 x              2.11
Bootstrap samples 2
Original data
# A tibble: 6 × 3
     id       x       y
  <int>   <dbl>   <dbl>
1     1  0.432   1.53
2     2 -2.01    1.80
3     3 -0.0467  1.43
4     4 -1.05    0.0518
5     5  0.327   0.820
6     6 -0.679  -0.961
Original estimates:
# A tibble: 2 × 2
  term        estimate
  <chr>          <dbl>
1 (Intercept)   0.801
2 x             0.0450
Sample with replacement:
# A tibble: 6 × 3
     id       x      y
  <int>   <dbl>  <dbl>
1     2 -2.01    1.80
2     5  0.327   0.820
3     1  0.432   1.53
4     6 -0.679  -0.961
5     3 -0.0467  1.43
6     2 -2.01    1.80
Different data \(\rightarrow\) new estimates:
# A tibble: 2 × 2
  term        estimate
  <chr>          <dbl>
1 (Intercept)    0.913
2 x             -0.236
Bootstrap samples 3
Original data
# A tibble: 6 × 3
     id       x       y
  <int>   <dbl>   <dbl>
1     1  0.432   1.53
2     2 -2.01    1.80
3     3 -0.0467  1.43
4     4 -1.05    0.0518
5     5  0.327   0.820
6     6 -0.679  -0.961
Original estimates:
# A tibble: 2 × 2
  term        estimate
  <chr>          <dbl>
1 (Intercept)   0.801
2 x             0.0450
Sample with replacement:
# A tibble: 6 × 3
     id      x      y
  <int>  <dbl>  <dbl>
1     6 -0.679 -0.961
2     1  0.432  1.53
3     5  0.327  0.820
4     6 -0.679 -0.961
5     6 -0.679 -0.961
6     5  0.327  0.820
Different data >> new estimates:
# A tibble: 2 × 2
  term        estimate
  <chr>          <dbl>
1 (Intercept)    0.357
2 x              1.96
Interval estimation
But first, let’s dive our way back to the 2024 Paris Olympics


Data: Diving at the 2024 Paris Olympics
- Data on scores from every dive in the final rounds of the 2024 Paris Olympic games diving events
- Scraped from Wikipedia and the Olympics website
- Each diver performs six dives
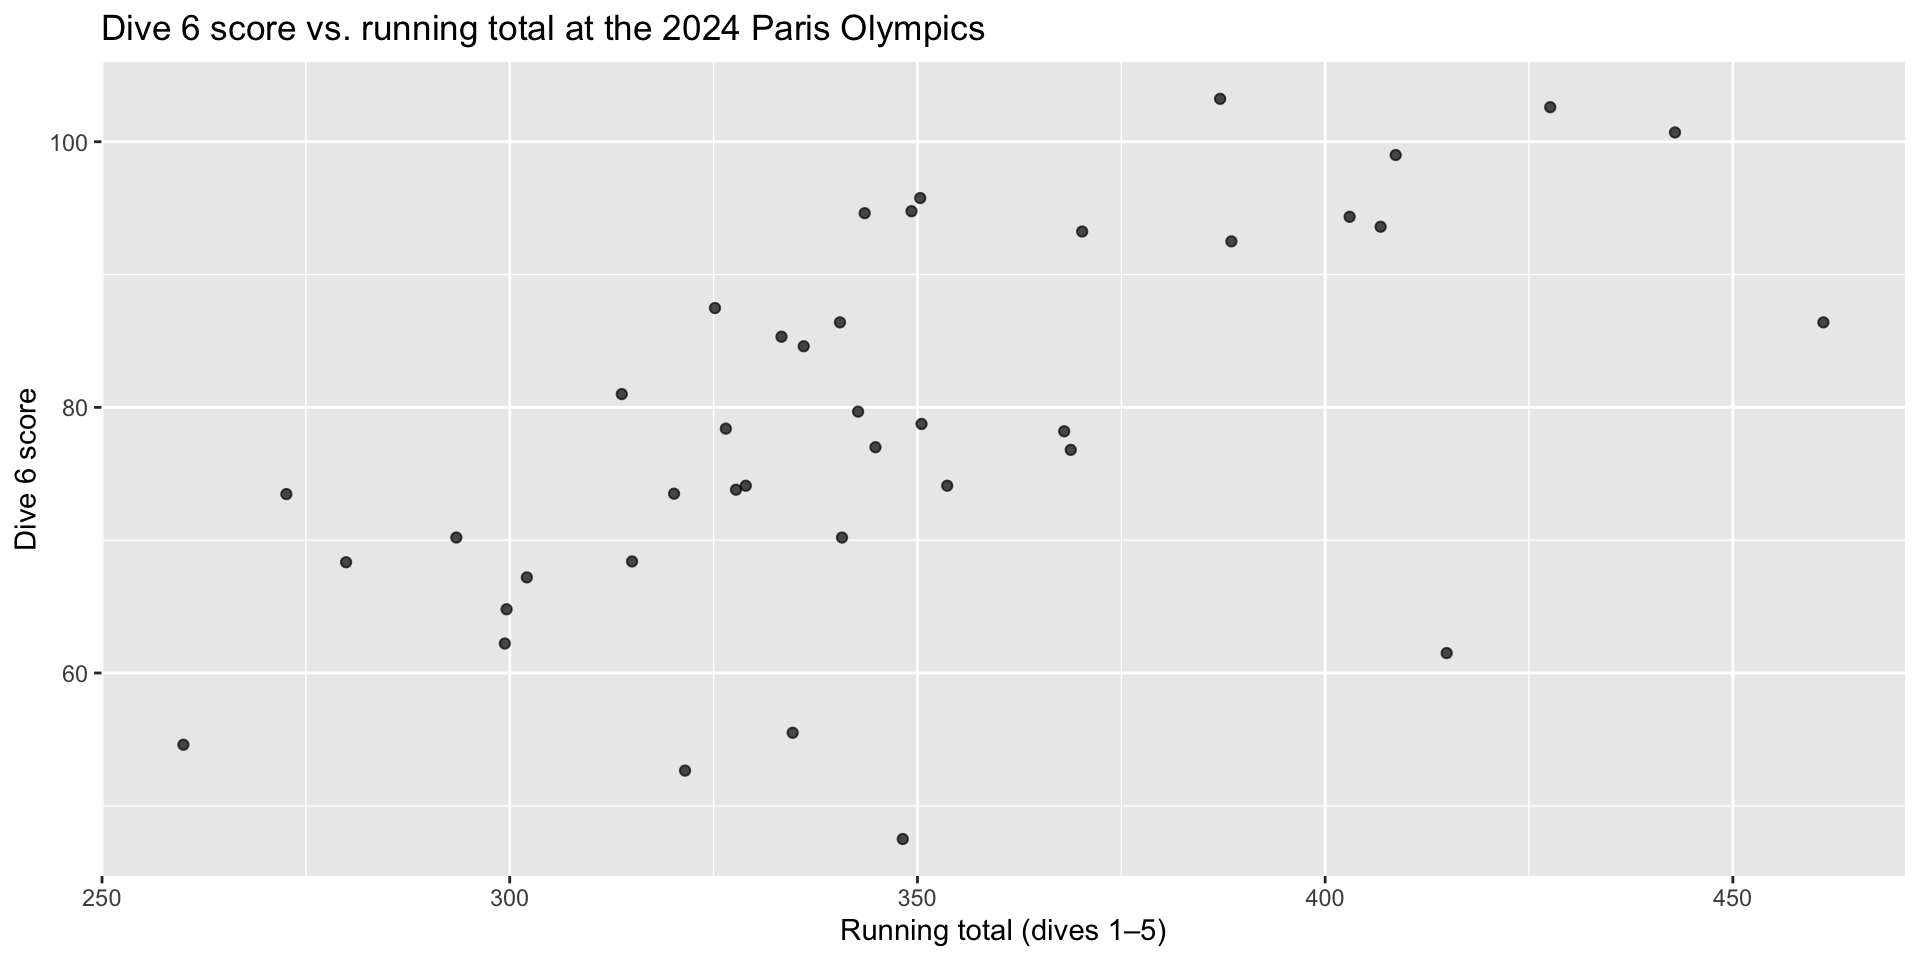
Goal: Use a diver’s running total of their first 5 dives to understand variability in the score of their final dive.

Exploratory data analysis
Code
ggplot(diving, aes(x = running_total, y = Dive_6)) +
  geom_point(alpha = 0.7) +
  labs(
    x = "Running total (dives 1–5)",
    y = "Dive 6 score",
    title = "Dive 6 score vs. running total at the 2024 Paris Olympics"
  )
Modeling
diving_fit <- linear_reg() |>
  fit(Dive_6 ~ running_total, data = diving)

tidy(diving_fit) |>
kable(digits = 2)| term | estimate | std.error | statistic | p.value |
|---|---|---|---|---|
| (Intercept) | 13.33 | 14.47 | 0.92 | 0.36 |
| running_total | 0.19 | 0.04 | 4.57 | 0.00 |
. . .
-
Intercept: A diver with a running total of 0 is expected to score 13.33 on their final dive, on average.
- Is this interpretation useful?
- Slope: For each additional point in the running total, we expect the final dive score to be higher by 0.19 points, on average.
From sample to population
For each additional point in the running total, we expect the final dive score to be higher by 0.19 points, on average.
- This estimate is valid for the single sample of 40 divers.
- But what if we’re not interested in quantifying this relationship only in this sample?
- What if we want to say something about the relationship between these variables for all competitive divers?
Statistical inference
Statistical inference provide methods and tools so we can use the single observed sample to make valid statements (inferences) about the population it comes from
For our inferences to be valid, the sample should be random and representative of the population we’re interested in
Inference for simple linear regression
Calculate a confidence interval for the slope, \(\beta_1\) (today)
Conduct a hypothesis test for the slope, \(\beta_1\) (tomorrow)
Confidence interval
- A plausible range of values for a population parameter is called a confidence interval
- Using only a single point estimate is like fishing in a murky lake with a spear, and using a confidence interval is like fishing with a net
- We can throw a spear where we saw a fish but we will probably miss, if we toss a net in that area, we have a good chance of catching the fish
- Similarly, if we report a point estimate, we probably will not hit the exact population parameter, but if we report a range of plausible values we have a good shot at capturing the parameter
Confidence interval for the slope
A confidence interval will allow us to make a statement like “For each additional point in the running total, the model predicts the final dive score to be higher, on average, by 0.19 points, plus or minus X points.”
. . .
Should X be 0.01? 0.1? 1?
If we were to take another sample of 40 divers, would we expect the slope calculated based on that sample to be exactly 0.19? Off by 0.01? 0.1? 1?
The answer depends on how variable (from one sample to another sample) the sample statistic (the slope) is
We need a way to quantify the variability of the sample statistic
Quantify the variability of the slope
for estimation
- Two approaches:
- Via simulation (what we’ll do in this course)
- Via mathematical models (what you can learn about in future courses)
-
Bootstrapping to quantify the variability of the slope for the purpose of estimation:
- Bootstrap new samples from the original sample
- Fit models to each of the samples and estimate the slope
- Use features of the distribution of the bootstrapped slopes to construct a confidence interval
Bootstrap sample 1


Bootstrap sample 2


Bootstrap sample 3


Bootstrap sample 4


Bootstrap sample 5


. . .
so on and so forth…
Bootstrap samples 1 - 5

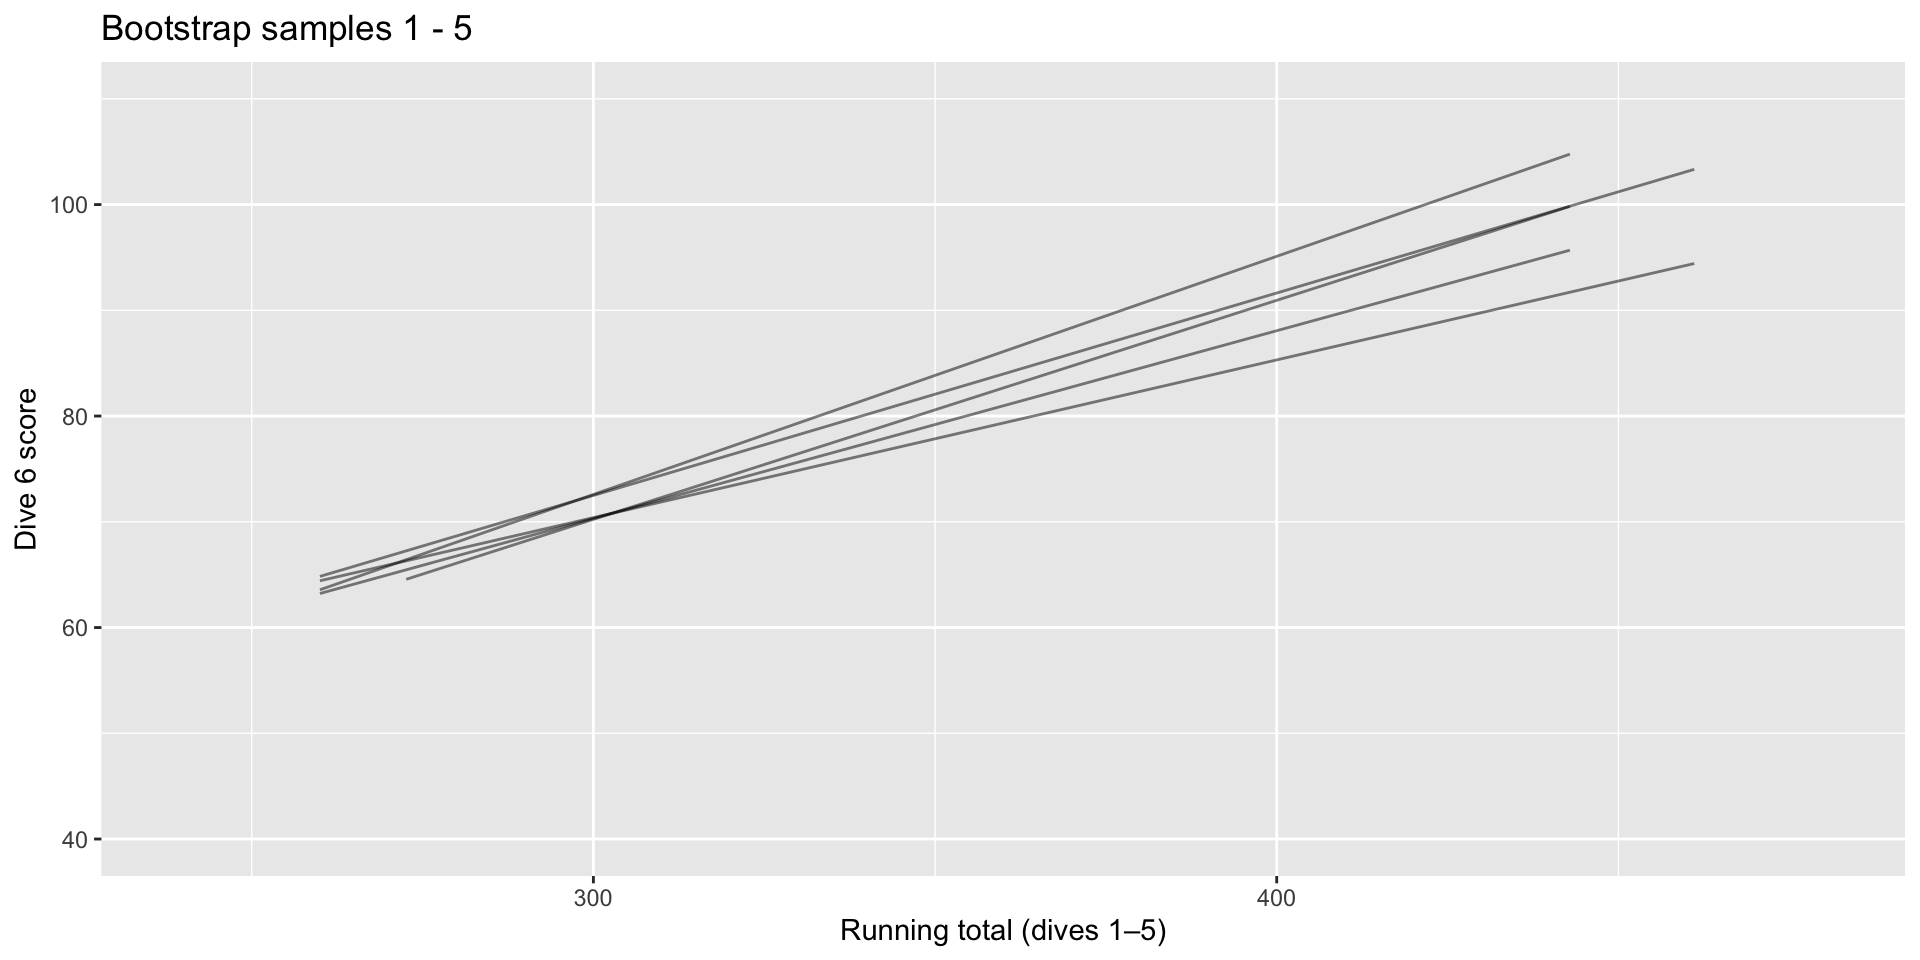
Bootstrap samples 1 - 100


Slopes of bootstrap samples
Fill in the blank: For each additional point in the running total, the model predicts the final dive score to be higher, on average, by 0.19 points, plus or minus ___ points.

Slopes of bootstrap samples
Fill in the blank: For each additional point in the running total, we expect the final dive score to be higher, on average, by 0.19 points, plus or minus ___ points.

Confidence level
How confident are you that the true slope is between 0 and 0.5? How about 0.1 and 0.3? How about 0.05 and 0.25?

95% confidence interval
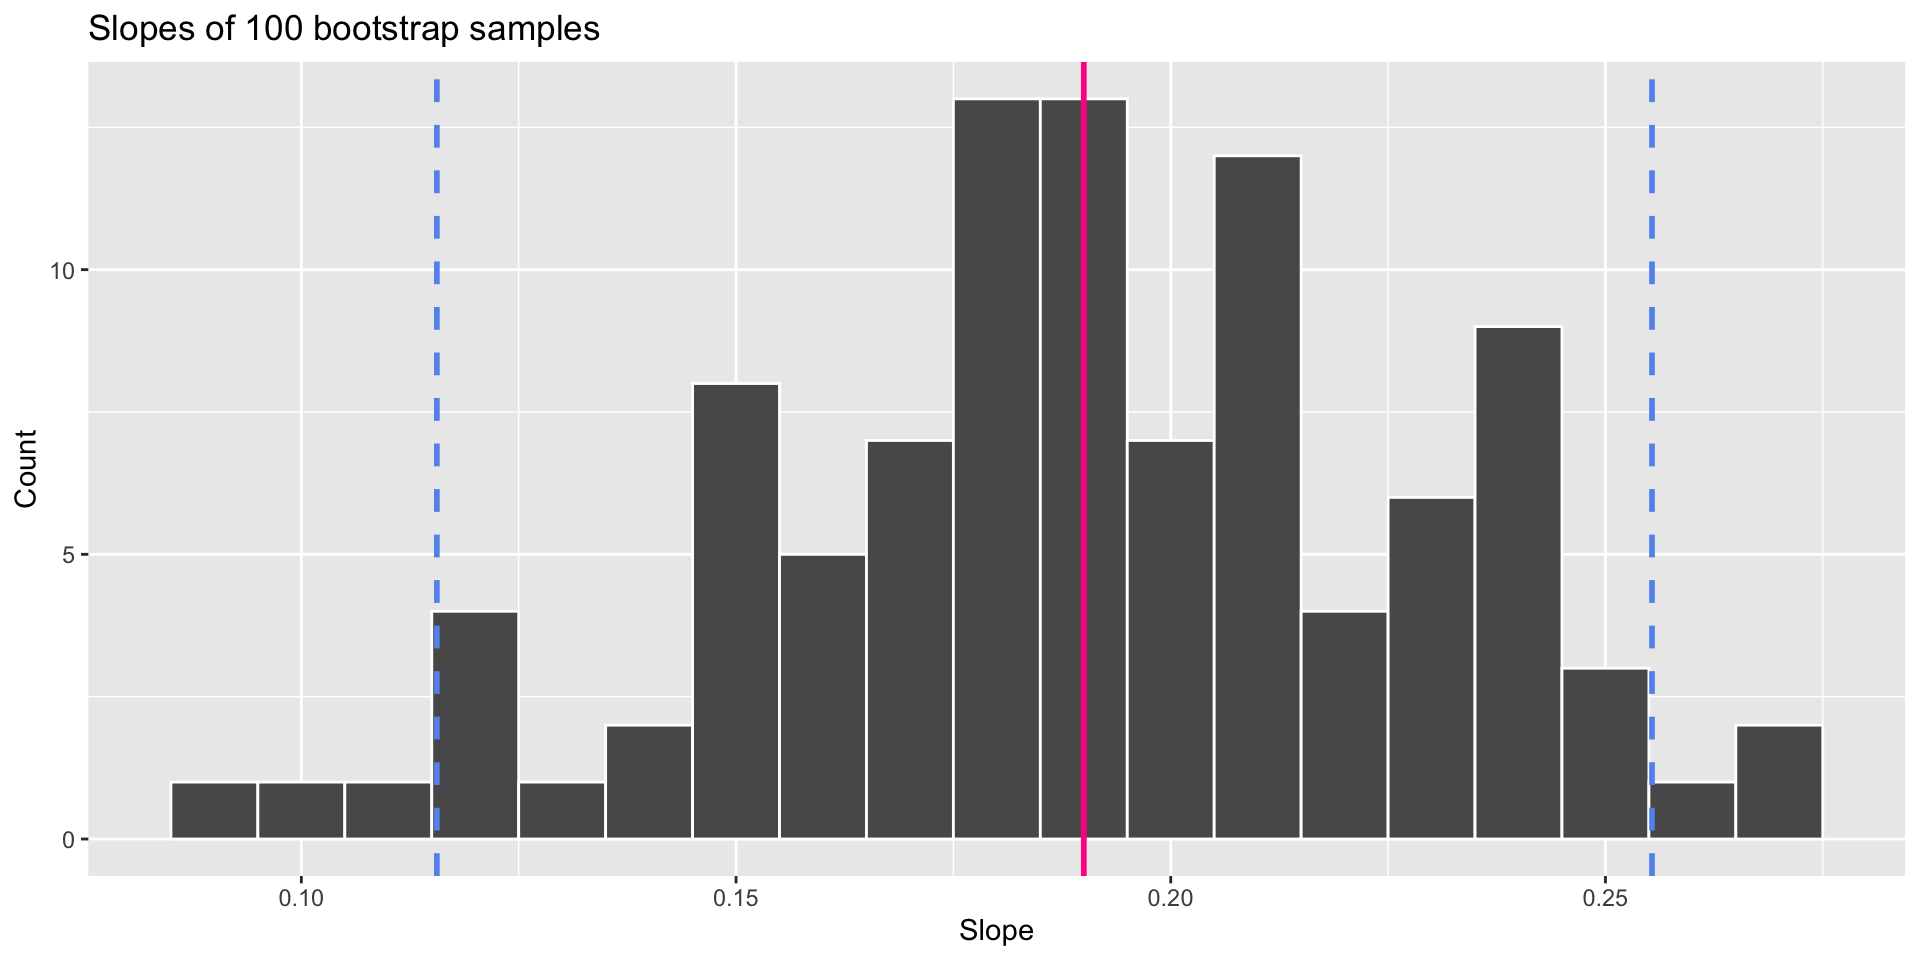
- A 95% confidence interval is bounded by the middle 95% of the bootstrap distribution
- “We are 95% confident that for each additional point in the running total, the model predicts the final dive score to be higher, on average, by 0.12 to 0.26 points.”
Where do the bounds come from?
Quantiles!
Think IQR! 50% of the bootstrap distribution is between the 25% quantile on the left and the 75% quantile on the right. But we want more than 50%
90% of the bootstrap distribution is between the 5% quantile on the left and the 95% quantile on the right;
95% of the bootstrap distribution is between the 2.5% quantile on the left and the 97.5% quantile on the right;
And so on.
Application exercise
Computing the CI for the slope I
Calculate the observed slope:
observed_fit <- diving |>
  specify(Dive_6 ~ running_total) |>
  fit()

observed_fit
# A tibble: 2 × 2
term estimate
<chr> <dbl>
1 intercept 13.3
2 running_total 0.189Aside: I don’t know why, but one quirk of
tidymodelsis that, when you are fitting a model for use in CI construction, you’ll usedf |> specify(y ~ x) |> fit(); when you’re fitting a model for general inference, you’ll uselinear_reg |> fit(y ~ x, data = df)
Computing the CI for the slope II
Take 100 bootstrap samples and have R fit models to each one:
set.seed(1120)

boot_fits <- diving |>
  specify(Dive_6 ~ running_total) |>
  generate(reps = 100, type = "bootstrap") |>
  fit()

boot_fits
# A tibble: 200 × 3
# Groups: replicate [100]
replicate term estimate
<int> <chr> <dbl>
1 1 intercept -9.05
2 1 running_total 0.254
3 2 intercept -21.1
4 2 running_total 0.287
5 3 intercept 4.36
6 3 running_total 0.209
7 4 intercept 2.89
8 4 running_total 0.222
9 5 intercept 11.6
10 5 running_total 0.197
# ℹ 190 more rowsComputing the CI for the slope III
Percentile method: Compute the 95% CI as the middle 95% of the bootstrap distribution:
Precision vs. accuracy
If we want to be very certain that we capture the population parameter, should we use a wider or a narrower interval? What drawbacks are associated with using a wider interval?
. . .

Precision vs. accuracy
How can we get best of both worlds – high precision and high accuracy?

Changing confidence level
How would you modify the following code to calculate a 90% confidence interval? How would you modify it for a 99% confidence interval?
Changing confidence level
## confidence level: 90%
get_confidence_interval(
  boot_fits, point_estimate = observed_fit,
  level = 0.90, type = "percentile"
)
# A tibble: 2 × 3
term lower_ci upper_ci
<chr> <dbl> <dbl>
1 intercept -15.0 29.1
2 running_total 0.140 0.266## confidence level: 99%
get_confidence_interval(
boot_fits, point_estimate = observed_fit,
level = 0.99, type = "percentile"
)# A tibble: 2 × 3
term lower_ci upper_ci
<chr> <dbl> <dbl>
1 intercept -24.8 51.6
2 running_total 0.0796 0.304Recap
Population: Complete set of observations of whatever we are studying, e.g., people, tweets, photographs, etc. (population size = \(N\))
Sample: Subset of the population, ideally random and representative (sample size = \(n\))
Sample statistic \(\ne\) population parameter, but if the sample is good, it can be a good estimate
Statistical inference: Discipline that concerns itself with the development of procedures, methods, and theorems that allow us to extract meaning and information from data that has been generated by stochastic (random) process
We report the estimate with a confidence interval, and the width of this interval depends on the variability of sample statistics from different samples from the population
Since we can’t continue sampling from the population, we bootstrap from the one sample we have to estimate sampling variability