Ethics in Data Science and a Brief History of Stats

Lecture 11

Author
Affiliation

Josh Lim

Duke University
STA 199 Summer 2026: Session 2
Adapted from slides by Mine Çetinkaya-Rundel, Katie Solarz & John Zito

Published

July 15, 2026

Today

  • Data do not speak for themselves. They require an interpretive lens, not all of which are created equal;

  • The practice of data science is not ethically neutral or value-free.

Misrepresentation

Misrepresenting data science results

Some common ways people do this, either intentionally or unintentionally, include:

  • Claiming causality where it’s not in the scope of inference of the underlying study

  • Generalizing results to some broader population that is not comparable to the underlying study population

  • Distorting axes and scales to make the data tell a different story

  • Visualizing spatial areas instead of human density for issues that depend on and affect humans

  • Omitting uncertainty in reporting

Recall from day 1…

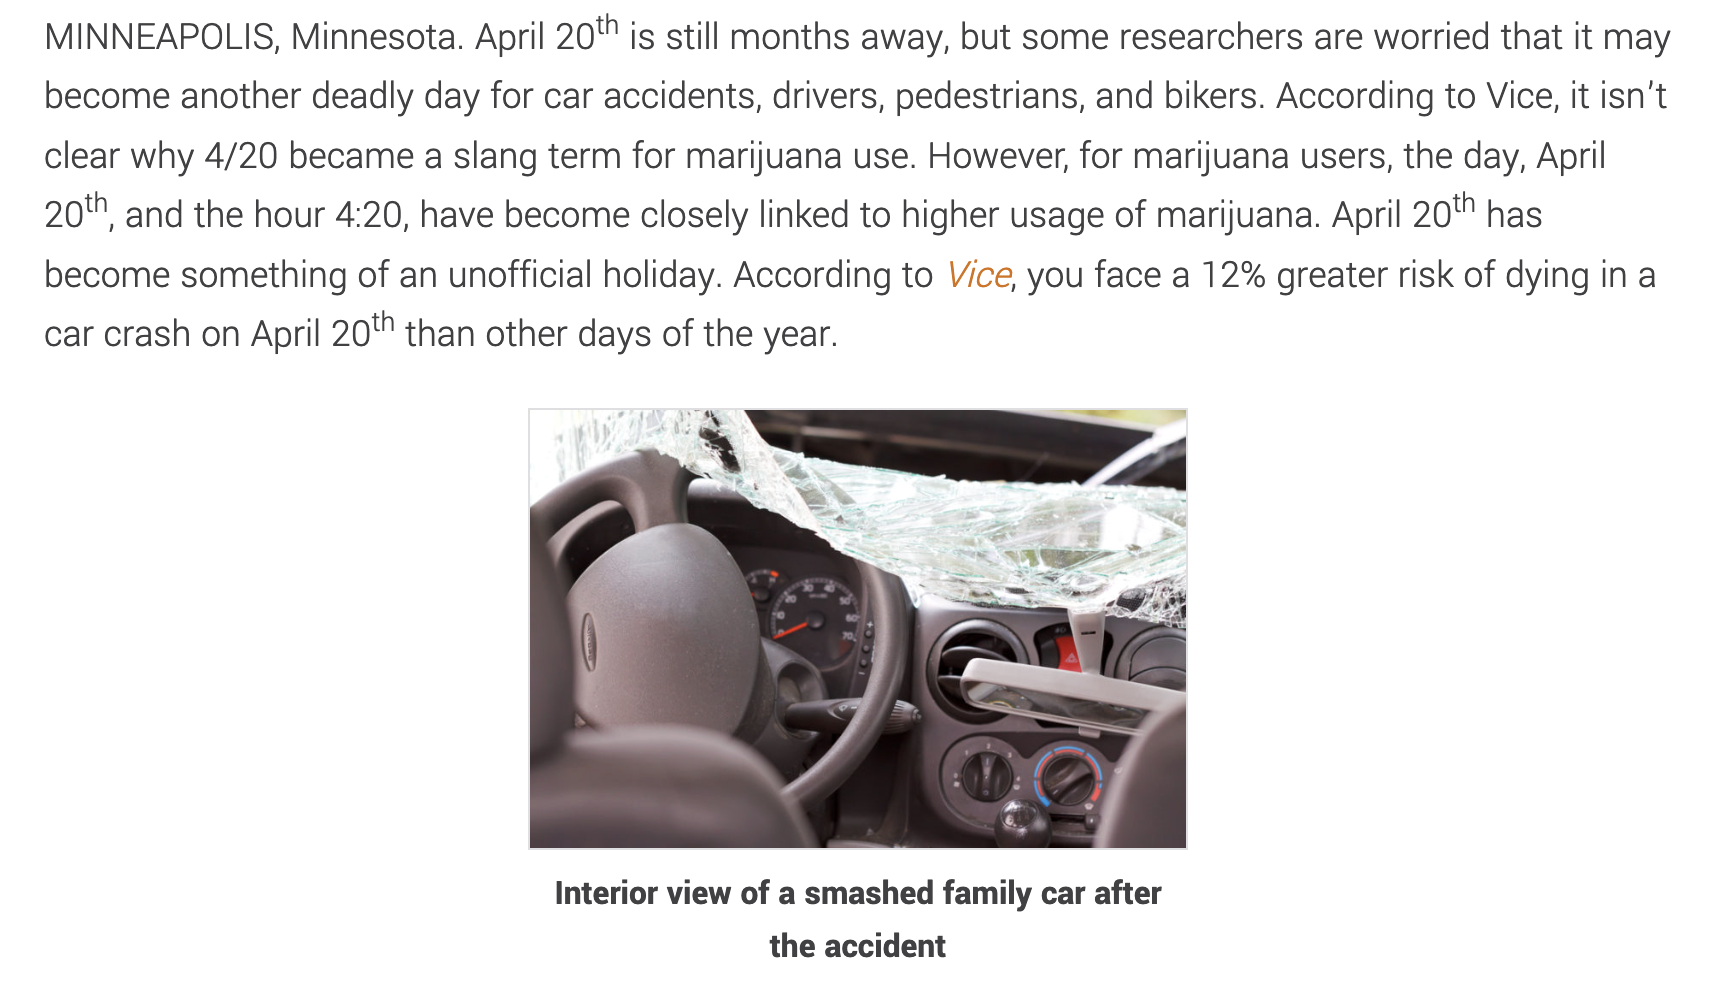
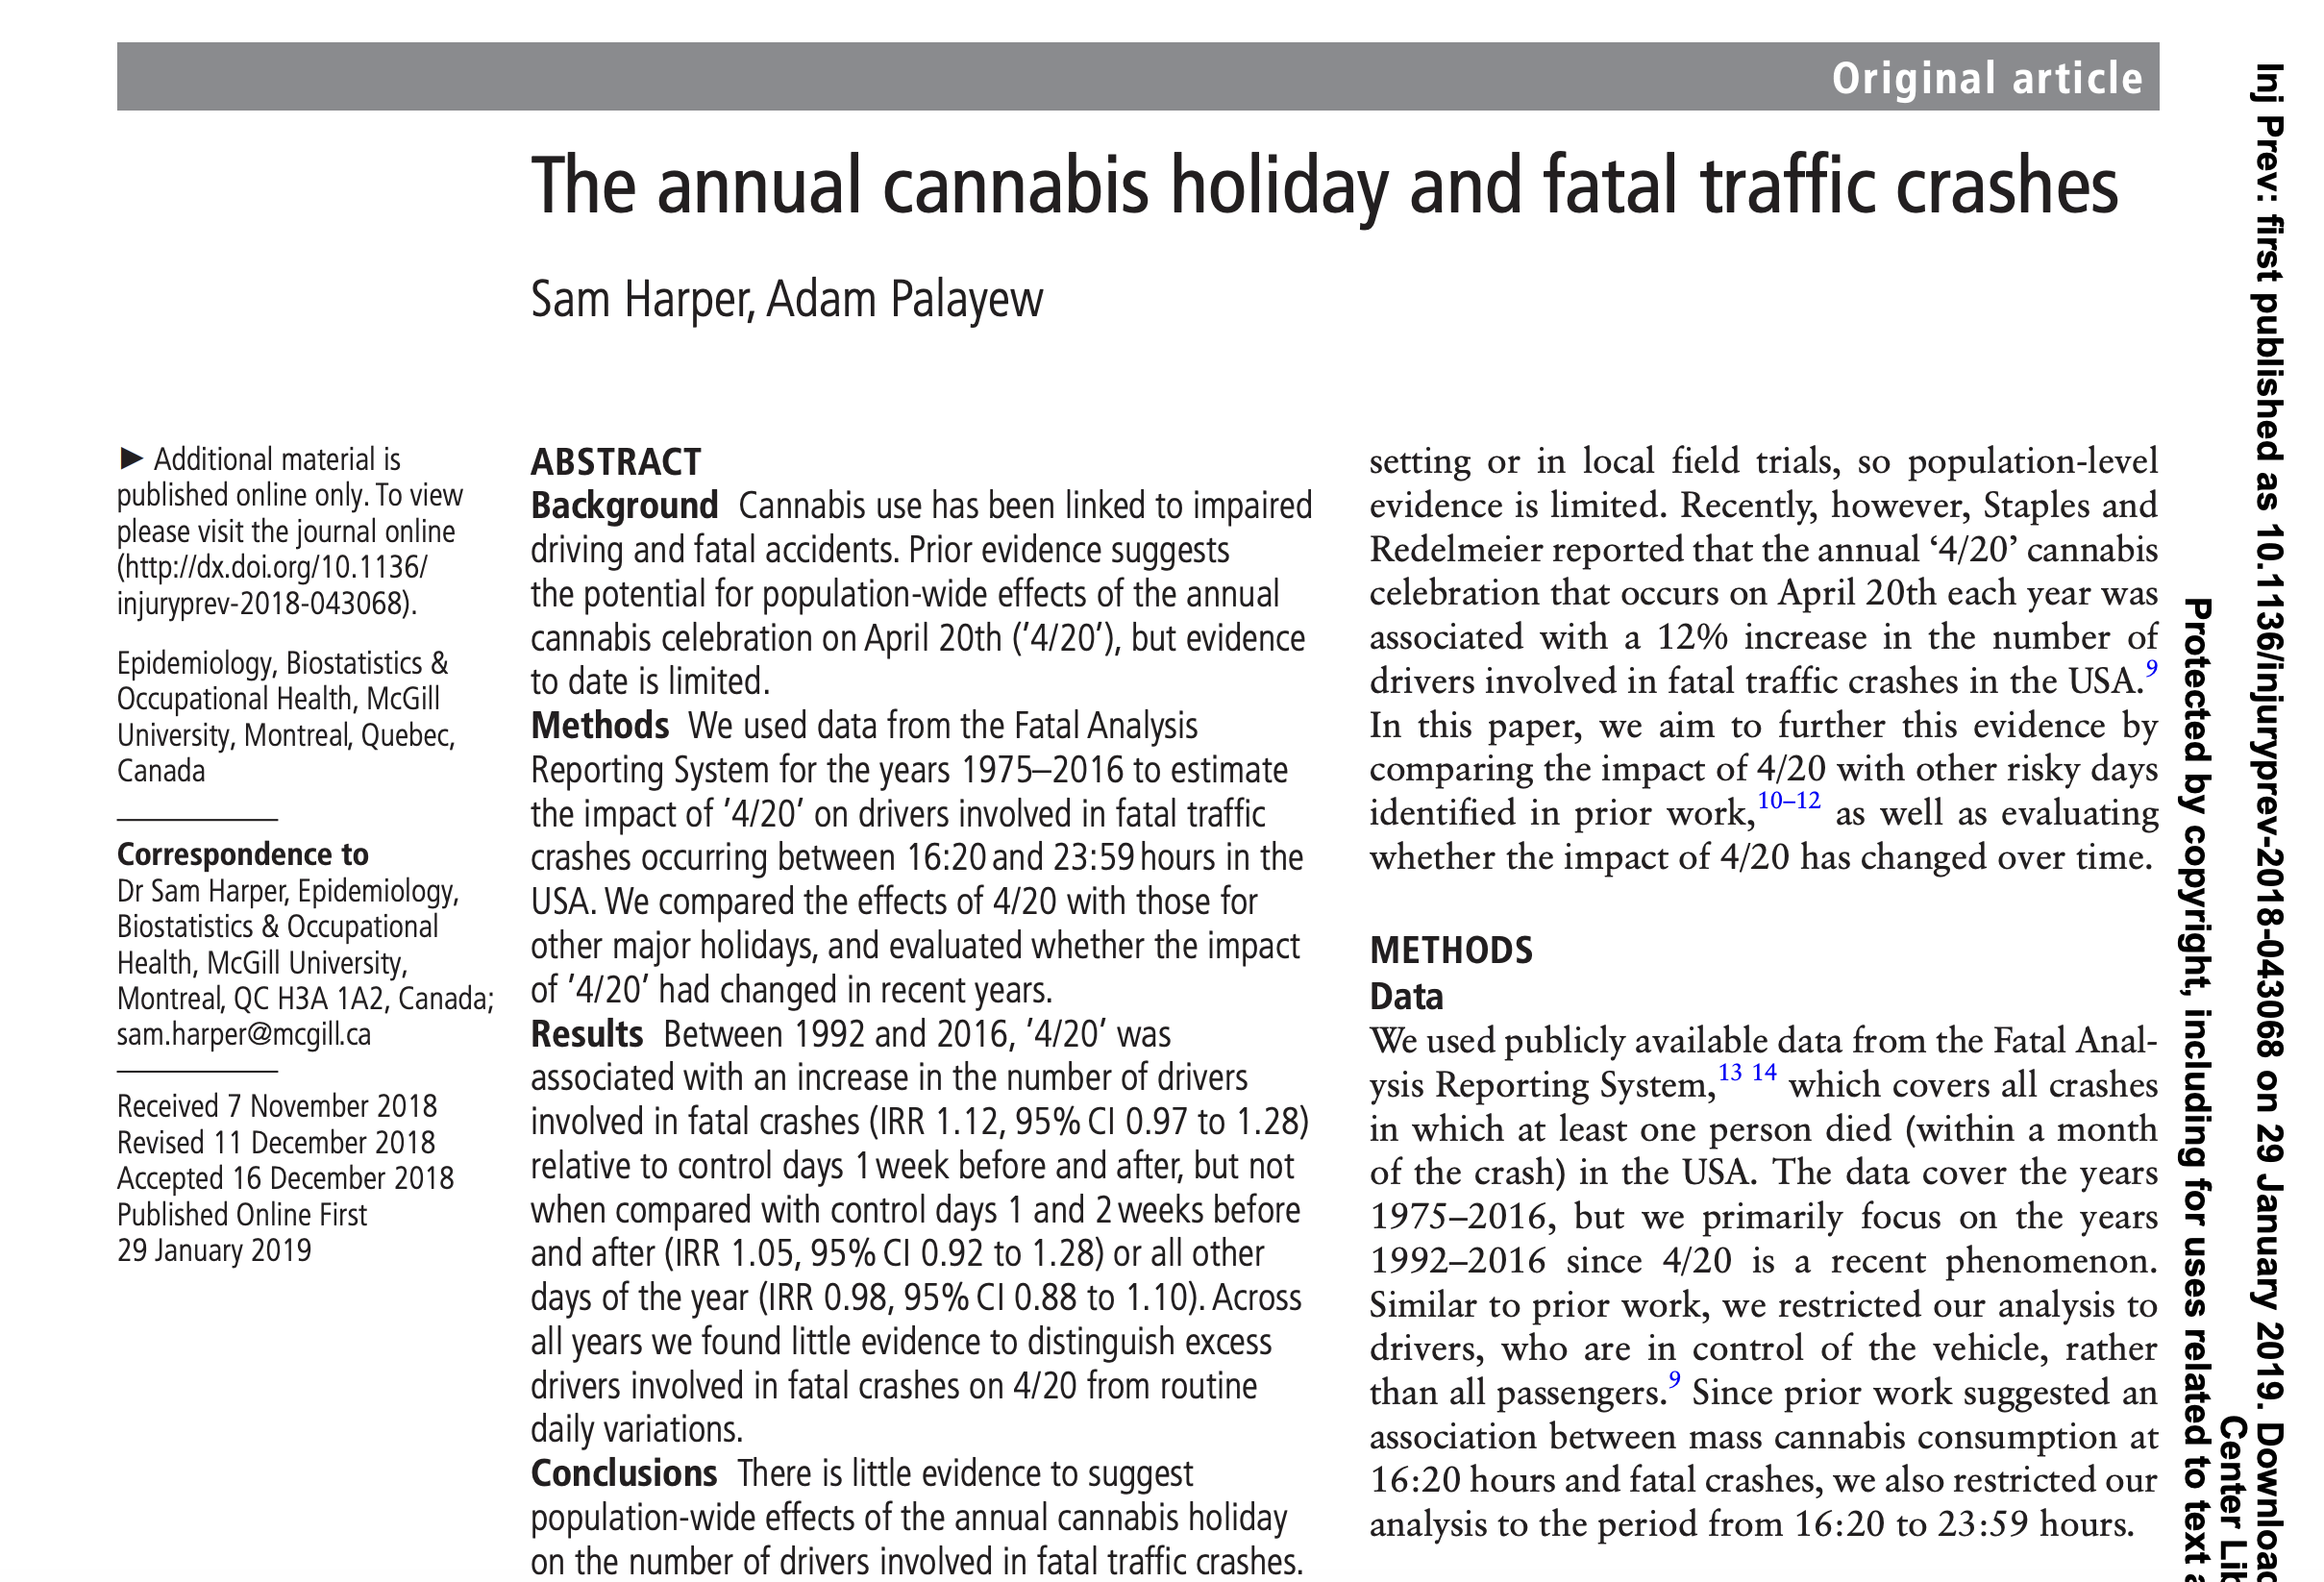
Harper and Palayew’s (2019) study, “The annual cannabis holiday and fatal traffic crashes”, available here.

Causality - TIME coverage

How plausible is the statement in the title of this article?

Alice Park. Exercise Can Lower Risk of Some Cancers By 20%. Time Magazine. 16 May 2016.

Causality - LA Times coverage

What does “research shows” mean?

Melissa Healy. Exercising drives down risk for 13 cancers, research shows.

Los Angeles Times. 16 May 2016.

Causality - Original study

Moore, Steven C., et al. “Association of leisure-time physical activity with risk of 26 types of cancer in 1.44 million adults.” JAMA internal medicine 176.6 (2016): 816-825.

  • Volunteers were asked about their physical activity level over the preceding year.
  • Half exercised less than about 150 minutes per week, half exercised more.
  • Compared to the bottom 10% of exercisers, the top 10% had lower rates of esophageal, liver, lung, endometrial, colon, and breast cancer.
  • Researchers found no association between exercising and 13 other cancers (e.g. pancreatic, ovarian, and brain).

Carl Bergstrom and Jevin West. Calling Bullshit: The art of skepticism in a data-driven world.

Random House, 2020.

Sharon Begley. “Does exercise prevent cancer?”. StatNews. 16 May 2016.

Axes and scales - Tax cuts

What is the difference between these two pictures? Which presents a better way to represent these data?

Christopher Ingraham. “You’ve been reading charts wrong. Here’s how a pro does it.”. The Washington Post. 14 October 2019.

Axes and scales - Cost of gas

What is wrong with this picture? How would you correct it?

Axes and scales - Cost of gas

Code
df <- tibble(
  date = ymd(c("2019-11-01", "2020-10-25", "2020-11-01")),
  cost = c(3.17, 3.51, 3.57)
)
ggplot(df, aes(x = date, y = cost, group = 1)) +
  geom_point() +
  geom_line() +
  geom_label(aes(label = cost), hjust = -0.25) +
  labs(
    title = "Cost of gas",
    subtitle = "National average",
    x = NULL, y = NULL, 
    caption = "Source: AAA Fuel Gauge Report"
  ) +
  scale_x_continuous(
    breaks = ymd(c("2019-11-01", "2020-10-25", "2020-11-01")), 
    labels = c("Last year", "Last week", "Current"),
    guide = guide_axis(angle = 90),
    limits = as.numeric(ymd(c("2019-11-01", "2020-11-29"))),
    minor_breaks = ymd(c("2019-11-01", "2020-10-25", "2020-11-01"))
  ) +
  scale_y_continuous(labels = label_dollar())

Axes and scales - COVID in GA

What is wrong with this picture? How would you correct it?

Georgia Department of Public Health. 11 May 2020.

Axes and scales - COVID in GA

Lucy D’Agostino McGowan. Graph detective. Live Free or Dichotomize. 17 May 2020.

Axes and scales - Planned Parenthood services

What is wrong with this picture? How would you correct it?

Axes and scales - Planned Parenthood services

Code
pp <- tibble(
  year = c(2006, 2006, 2013, 2013),
  service = c("Abortion", "Cancer", "Abortion", "Cancer"),
  n = c(289750, 2007371, 327000, 935573)
)

ggplot(pp, aes(x = year, y = n, color = service)) +
  geom_point(size = 2) +
  geom_line(linewidth = 1) +
  geom_text(aes(label = n), nudge_y = 100000) +
  geom_text(
    aes(label = year), 
    nudge_y = 200000, 
    color = "darkgray"
  ) +
  labs(
    title = "Services provided by Planned Parenthood",
    caption = "Source: Planned Parenthood",
    x = NULL,
    y = NULL
  ) +
  scale_x_continuous(breaks = c(2006, 2013)) +
  scale_y_continuous(labels = label_number(big.mark = ",")) +
  scale_color_manual(values = c("red", "purple")) +
  annotate(
    geom = "text",
    label = "Abortions",
    x = 2009.5,
    y = 400000,
    color = "red"
  ) +
  annotate(
    geom = "text",
    label = "Cancer screening\nand prevention services",
    x = 2010.5,
    y = 1600000, 
    color = "purple"
  ) +
  theme_minimal() +
  theme(legend.position = "none")

Uncertainty - Catalan independence

On December 19, 2014, the front page of Spanish national newspaper El País read “Catalan public opinion swings toward ‘no’ for independence, says survey”.

Uncertainty - Catalan independence

Algorithmic bias

California Proposition 25 (2020)

Popular referendum on 2018’s Senate Bill 10:

  • YES: replace cash bail with “risk assessment.”

    • Democratic Party, Governor Gavin Newson, League of Women Voters of California, California Medical Association, Democracy for America (progressive PAC), etc.
  • NO: keep the cash bail system.

    • Republican Party, American Bail Coalition, ACLU of Southern California, NAACP, California Asian Pacific Chamber of Commerce, etc.
  • If passed, each county would be empowered to develop a tool that predicts the risk of a suspect reoffending before trial.

  • Judges would consult this prediction to make bail decisions.

What might “risk assessment” look like?

Something we will study in two weeks:

Let’s say above the line means high risk, which means no bail. Is this progress?

What happens when we try “predictive policing”?

2016 ProPublica article on algorithm used for rating a defendant’s risk of future crime:

In forecasting who would re-offend, the algorithm made mistakes with black and white defendants at roughly the same rate but in very different ways.

  • The formula was particularly likely to falsely flag black defendants as future criminals, wrongly labeling them this way at almost twice the rate as white defendants.

  • White defendants were mislabeled as low risk more often than black defendants.

Source: ProPublica

Notice anything?

What is common among the defendants who were assigned a high/low risk score for reoffending?

“But race wasn’t in my model”

How can an algorithm that doesn’t use race as input data be racist?

Predicting ethnicity

Improving Ecological Inference by Predicting Individual Ethnicity from Voter Registration Record (Imran and Khan, 2016)

In both political behavior research and voting rights litigation, turnout and vote choice for different racial groups are often inferred using aggregate election results and racial composition. Over the past several decades, many statistical methods have been proposed to address this ecological inference problem. We propose an alternative method to reduce aggregation bias by predicting individual-level ethnicity from voter registration records. Building on the existing methodological literature, we use Bayes’s rule to combine the Census Bureau’s Surname List with various information from geocoded voter registration records. We evaluate the performance of the proposed methodology using approximately nine million voter registration records from Florida, where self-reported ethnicity is available. We find that it is possible to reduce the false positive rate among Black and Latino voters to 6% and 3%, respectively, while maintaining the true positive rate above 80%. Moreover, we use our predictions to estimate turnout by race and find that our estimates yields substantially less amounts of bias and root mean squared error than standard ecological inference estimates. We provide open-source software to implement the proposed methodology. The open-source software is available for implementing the proposed methodology.

wru package

The said “source software” is the wru package: https://github.com/kosukeimai/wru.

Do you have any ethical concerns about installing this package?

wru package

Was the publication of this model ethical? Does the open-source nature of the code affect your answer? Is it ethical to use this software? Does your answer change depending on the intended use?

library(wru)
predict_race(voter.file = voters, surname.only = TRUE) |>
  select(surname, pred.whi, pred.bla, pred.his, pred.asi, pred.oth)
      surname    pred.whi    pred.bla     pred.his    pred.asi
1      Khanna 0.045110474 0.003067623 0.0068522723 0.860411906
2        Imai 0.052645440 0.001334812 0.0558160072 0.719376581
3      Rivera 0.043285692 0.008204605 0.9136195794 0.024316883
4     Fifield 0.895405704 0.001911388 0.0337464844 0.011079323
5        Zhou 0.006572555 0.001298962 0.0005388581 0.982365594
6    Ratkovic 0.861236727 0.008212824 0.0095395642 0.011334635
7     Johnson 0.543815322 0.344128607 0.0272403940 0.007405765
8       Lopez 0.038939877 0.004920643 0.9318797791 0.012154125
10 Wantchekon 0.330697188 0.194700665 0.4042849478 0.021379541
9       Morse 0.866360147 0.044429853 0.0246568086 0.010219712
      pred.oth
1  0.084557725
2  0.170827160
3  0.010573240
4  0.057857101
5  0.009224032
6  0.109676251
7  0.077409913
8  0.012105576
10 0.048937658
9  0.054333479

wru package

me <- tibble(surname = "Lim")

predict_race(voter.file = me, surname.only = TRUE)
  surname   pred.whi    pred.bla   pred.his  pred.asi   pred.oth
1     Lim 0.01909695 0.001653277 0.01328434 0.9166572 0.04930821

California Prop 25 did not pass

The cash bail system was retained:

Choice Votes Percent
Yes 7,232,380 43.59%
No 9,358,226 56.41%
  • reasonable people can debate if this outcome is good or bad;
  • every Californian was invited to decide whether statistics and data science should be deployed to make decisions with major social consequences. They opted out;
  • This vote was held in the pre-ChatGPT era. What would the outcome be today? Is the case for YES stronger or weaker?

Another algorithmic decision…

Armies of stats PhDs go to work on these models. They have no training in the ethics of what they’re doing.

A success story?

. . .

Data + Model to predict timing of menstrual cycle:

. . .

A perfect microcosm of the themes of our course, and maybe one of the real triumphs of data and modeling improving modern life.

. . .

Some good news?

Faster, more accurate cancer screening?

Augmenting doctors’ diagnostic capacity so that they make fewer mistakes, treat more people, and focus on other aspects of care:

Recent Nobel Prize

  • AlphaFold2: “predicting 3D structures [of proteins] (\(y\)) directly from the primary amino acid sequence (\(x\)).”

  • “researchers can now better understand antibiotic resistance and create images of enzymes that can decompose plastic.”

Further reading

How Charts Lie

How Charts Lie

Getting Smarter about Visual Information

by Alberto Cairo

Calling Bullshit

Calling Bullshit
The Art of Skepticism in a
Data-Driven World

by Carl Bergstrom and Jevin West

Machine Bias

Machine Bias

by Julia Angwin, Jeff Larson, Surya Mattu, and Lauren Kirchner

Ethics and Data Science

Ethics and Data Science

by Mike Loukides, Hilary Mason, DJ Patil
(Free Kindle download)

Weapons of Math Destruction

Weapons of Math Destruction
How Big Data Increases Inequality and Threatens Democracy

by Cathy O’Neil

Algorithms of Oppression

Algorithms of Oppression
How Search Engines Reinforce Racism

by Safiya Umoja Noble

And more recently…

How AI discriminates and what that means for your Google habit
A conversation with UCLA internet studies scholar Safiya Noble

by Julia Busiek

Parting thoughts

  • At some point during your data science learning journey you will learn tools that can be used unethically

  • You might also be tempted to use your knowledge in a way that is ethically questionable either because of business goals or for the pursuit of further knowledge (or because your boss told you to do so)

How do you train yourself to make the right decisions (or reduce the likelihood of accidentally making the wrong decisions) at those points?

A Brief History of Statistics (Buckle Up)

Origins

  • Compared to other sciences, statistics is relatively young: most major contributions happened in the 1900s -Three main waves
  • Franics Galton and Karl Pearson evolving the field from math
  • Sir Ronald Fisher and The Design of Experiments
  • Jerzy Neyman and Egon Pearson

Galton and Pearson

  • Galton introduced standard deviation, correlation, regression
  • Together with Karl Pearson founded mathematical statistics
  • Other contributions: hypothesis testing, p-values
  • First statistics department in University College London

Fisher and The Design of Experiments

  • Many contributions fundamental to experimental design
  • Analysis of variance or ANOVA
  • Agriculture! A very popular data source for statistics

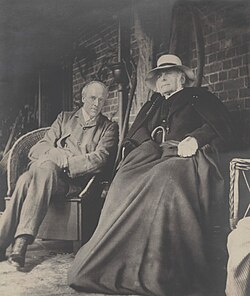
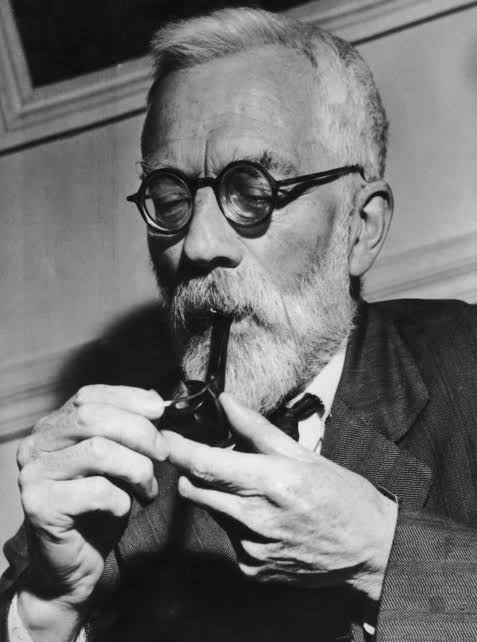
Besides statistics, what did these founding father of statistics have in common?

RACISM!

Why I bring this up?

  • Statistics was used to advance eugenics “research”
  • Acknowledging that statistics is not merely numbers but rather a powerful tool that caused real harm is a starting point toward ethical and thoughtful usage
  • The midterm tomorrow features the popular (and seemingly innocuous) dataset “Iris”: a very famous dataset on flowers
  • Unfortunately, one of the original uses of that dataset was by Fisher in the Annals of Eugenics
  • We will use it tomorrow with the understanding that while these people involved in eugenics created many of the methods today, we hold the power to use them ethically and responsibly
Mathematics Genealogy Project

https://www.genealogy.math.ndsu.nodak.edu/

Wrapping Everything Up

  • Data science and statistics contains more power than you think
  • You have the tools to lead or mislead the public: use your knowledge for good
  • Be critical about the methods you learn