Rows: 614
Columns: 9
$ treat    <int> 1, 1, 1, 1, 1, 1, 1, 1, 1, 1, 1, 1, 1, 1, 1, 1, 1, …
$ age      <int> 37, 22, 30, 27, 33, 22, 23, 32, 22, 33, 19, 21, 18,…
$ educ     <int> 11, 9, 12, 11, 8, 9, 12, 11, 16, 12, 9, 13, 8, 10, …
$ race     <fct> black, hispan, black, black, black, black, black, b…
$ married  <int> 1, 0, 0, 0, 0, 0, 0, 0, 0, 1, 0, 0, 0, 1, 0, 0, 0, …
$ nodegree <int> 1, 1, 0, 1, 1, 1, 0, 1, 0, 0, 1, 0, 1, 1, 1, 1, 0, …
$ re74     <dbl> 0, 0, 0, 0, 0, 0, 0, 0, 0, 0, 0, 0, 0, 0, 0, 0, 0, …
$ re75     <dbl> 0, 0, 0, 0, 0, 0, 0, 0, 0, 0, 0, 0, 0, 0, 0, 0, 0, …
$ re78 <dbl> 9930.0460, 3595.8940, 24909.4500, 7506.1460, 289.78…Observational Studies
Lecture 23
Josh Lim
Duke University
STA 199 Summer 2026: Session 2
Adapted from slides by Mine Çetinkaya-Rundel, Katie Solarz & John Zito
August 4, 2026
Recap
Last lecture: RCTs
We showed that randomization is incredibly powerful: it makes \(Z \perp X\), so any difference in \(Y\) between groups must be due to treatment
This gave us the license to say causes: “receiving VWG OIT causes an increase in max tolerated wheat protein dose”
Today: what happens when we can’t randomize?
When randomization isn’t possible
Ethical: you cannot randomly assign people to smoke, to not receive healthcare, or to experience childhood poverty
Practical: policy changes happen at scale. You can’t “randomize” a country’s minimum wage law
Historical: many causal questions are about events that already happened
Most real-world causal questions are answered with observational data
Observational Studies
What is an observational study?
In an observational study, treatment is not assigned by the researcher. Subjects choose, or are assigned by nature or circumstance
Examples: surveys (including the Census), electronic health records, administrative data
Almost any dataset you encounter “in the wild” can be framed as an observational study. You just have to define what the treatment is
Key advantage over RCTs: easier and cheaper to collect, often with much larger sample sizes
The core issue
Without randomization, \(Z\) is not independent of \(X\): people who receive treatment differ systematically from those who don’t.
| Person | \(Z\) (Duke?) | \(X\) (Read Percy Jackson?) | \(Y\) (Odyssey rating) |
|---|---|---|---|
| A | 1 | Yes | 9 |
| B | 1 | Yes | 8 |
| C | 0 | No | 5 |
| D | 0 | No | 6 |
Is the difference in Odyssey ratings because of Duke vs. UNC, or because of Percy Jackson?
A concrete example
\(Z\): attended Duke (vs. UNC); \(Y\): rating of the new Odyssey movie; \(X\): read Percy Jackson as a kid
Duke students happen to be much more likely to have read Percy Jackson. \(Z\) and \(X\) are perfectly aligned
Percy Jackson fans also tend to rate the Odyssey higher. \(X\) affects \(Y\)
So the naive comparison (“Duke students rate the Odyssey higher”) actually reflects Percy Jackson fandom, not school identity
This is confounding: \(X \to Z\) and \(X \to Y\), creating a spurious association between \(Z\) and \(Y\)
Key takeaway
In an observational study, a naive difference in group means is not a valid causal estimate
We need to adjust for confounders \(X\) to recover the true treatment effect
The rest of today: two strategies for doing that
Matching
The idea of matching
Recall from last lecture: randomization balanced the covariates. The only systematic difference between groups was the treatment.
Our goal in observational studies: emulate that balance without running an experiment.
How? Matching.
Matching
For each treated unit, find one or more control units that look similar on \(X\)
This creates two new comparable cohorts: a matched treated group and a matched control group
Analyze the outcome across these cohorts, just as you would in a randomized experiment
Key requirement: matching only works if we have measured all important confounders. This is a strong, untestable assumption
The LaLonde Study
Context
LaLonde (1986) evaluated the National Supported Work (NSW) program, a 1970s job training intervention for disadvantaged workers.
Cohort: Disadvantaged workers (long-term unemployed, ex-offenders, welfare recipients)
Design: The original NSW had a randomized arm, but LaLonde compared its estimates against observational comparison groups drawn from national surveys, showing how badly naive methods can fail
Treatment (\(Z = 1\)): Participation in the NSW job training program
Control (\(Z = 0\)): Non-participants drawn from observational comparison groups
Outcome (\(Y\)): Earnings in 1978 (
re78)Covariates (\(X\)): Age, education, race, marital status, prior earnings (
re74,re75)
Data
-
treat: 1 = job training, 0 = no training -
re78: earnings in 1978 (outcome \(Y\)) -
age,educ,re74,re75, …: pre-treatment covariates (\(X\))
Naive estimate
# A tibble: 2 × 2
  treat mean_earnings
  <int>         <dbl>
1     0         6984.
2     1         6349.
The naive difference suggests training DECREASES earnings! (huh?)
But are the two groups actually comparable before treatment?
Your turn
Look at the balance table below. Which variables show the largest differences between treated and control groups? What does this tell us about the naive estimate?
What the imbalance tells us
Treated individuals have substantially lower prior earnings (
re74,re75) than controlsThe control group (from national surveys) is richer and more educated on average
A naive comparison overstates the earnings gap. The treated group is catching up from a lower baseline, not just benefiting from training
We need to adjust for these differences before drawing causal conclusions
Nearest-neighbor matching
m_out <- matchit(
  treat ~ age + educ + re74 + re75,
  data   = lalonde,
  method = "nearest"
)
summary(m_out, un = FALSE)
Call:
matchit(formula = treat ~ age + educ + re74 + re75, data = lalonde,
    method = "nearest")

Summary of Balance for Matched Data:
         Means Treated Means Control Std. Mean Diff. Var. Ratio
distance        0.3536        0.3523          0.0141     1.0160
age            25.8162       25.2811          0.0748     0.4690
educ           10.3459       10.4486         -0.0511     0.6392
re74         2095.5737     2137.7507         -0.0086     1.2576
re75         1532.0553     1385.2355          0.0456     1.7520
         eCDF Mean eCDF Max Std. Pair Dist.
distance    0.0088   0.0757          0.0179
age         0.0801   0.2486          1.4014
educ        0.0208   0.0973          1.0673
re74        0.0365   0.2541          0.1778
re75        0.0379   0.1946          0.6412

Sample Sizes:
          Control Treated
All           429     185
Matched       185     185
Unmatched     244       0
Discarded       0       0
Estimate on matched data
# A tibble: 2 × 5
  term        estimate std.error statistic  p.value
  <chr>          <dbl>     <dbl>     <dbl>    <dbl>
1 (Intercept)    5988.      533.    11.2   2.38e-25
2 treat           362.      754.     0.479 6.32e- 1
After matching, treated and control units are much more comparable on \(X\)
This estimate is our best causal guess under the no-unmeasured-confounders assumption
Compare to the naive estimate. Confounding matters!
Propensity scores
The curse of dimensionality
Covariate matching works well when \(X\) has only a few variables
With many covariates, it becomes nearly impossible to find good matches. Imagine trying to match on 10 variables simultaneously!
Example: match exactly on age, education, prior earnings, race, marital status, region, …
The probability of finding a near-identical control unit vanishes as the number of covariates grows
We need a smarter approach
The propensity score
Instead of matching on the full \(X\) vector, collapse it to a single number
-
The propensity score:
\[e(X) = P(Z = 1 \mid X)\]
The probability of receiving treatment, given covariates
Matching on this one number is sufficient to achieve balance on all of \(X\)
In a randomized experiment, \(e(X) = 0.5\) for everyone. Randomization makes treatment equally likely regardless of \(X\)
But how do we estimate it?
Every unit has a true \(e(X) = P(Z = 1 \mid X)\). We don’t observe it directly
Goal: estimate \(\hat{e}(X)\), the predicted probability of treatment given covariates
We want to model \(P(Z = 1)\) from \(X\) … what does that sound like?
Logistic regression! We already know how to do this
Estimating the propensity score
We estimate \(e(X)\) via logistic regression:
\[\log\frac{P(Z=1 \mid X)}{1 - P(Z=1 \mid X)} = \widehat{\beta_0} + \widehat{\beta_1} X_1 + \cdots + \widehat{\beta_p} X_p\]
Fit logistic regression of \(Z\) on \(X\)
Predicted probabilities \(\hat{e}(X_i)\) are the estimated propensity scores
Match treated and control units with similar \(\hat{e}(X)\)
The workflow
- Fit a logistic regression model: \(Z \sim X_1 + \cdots + X_p\)
- Extract predicted probabilities as propensity scores
- Match treated to control units with similar scores
- Check balance on \(X\) in the matched sample
- Estimate the treatment effect on the matched data
Step 1 & 2: fit model, get scores
ps_fit <- logistic_reg() |>
  fit(factor(treat) ~ age + educ + re74 + re75, data = lalonde)

lalonde <- lalonde |>
  mutate(ps = predict(ps_fit, type = "prob", new_data = lalonde)$.pred_1)

lalonde |>
  group_by(treat) |>
  summarise(mean_ps = mean(ps), sd_ps = sd(ps))
# A tibble: 2 × 3
treat mean_ps sd_ps
<int> <dbl> <dbl>
1 0 0.279 0.126
2 1 0.354 0.0901Visualize the scores
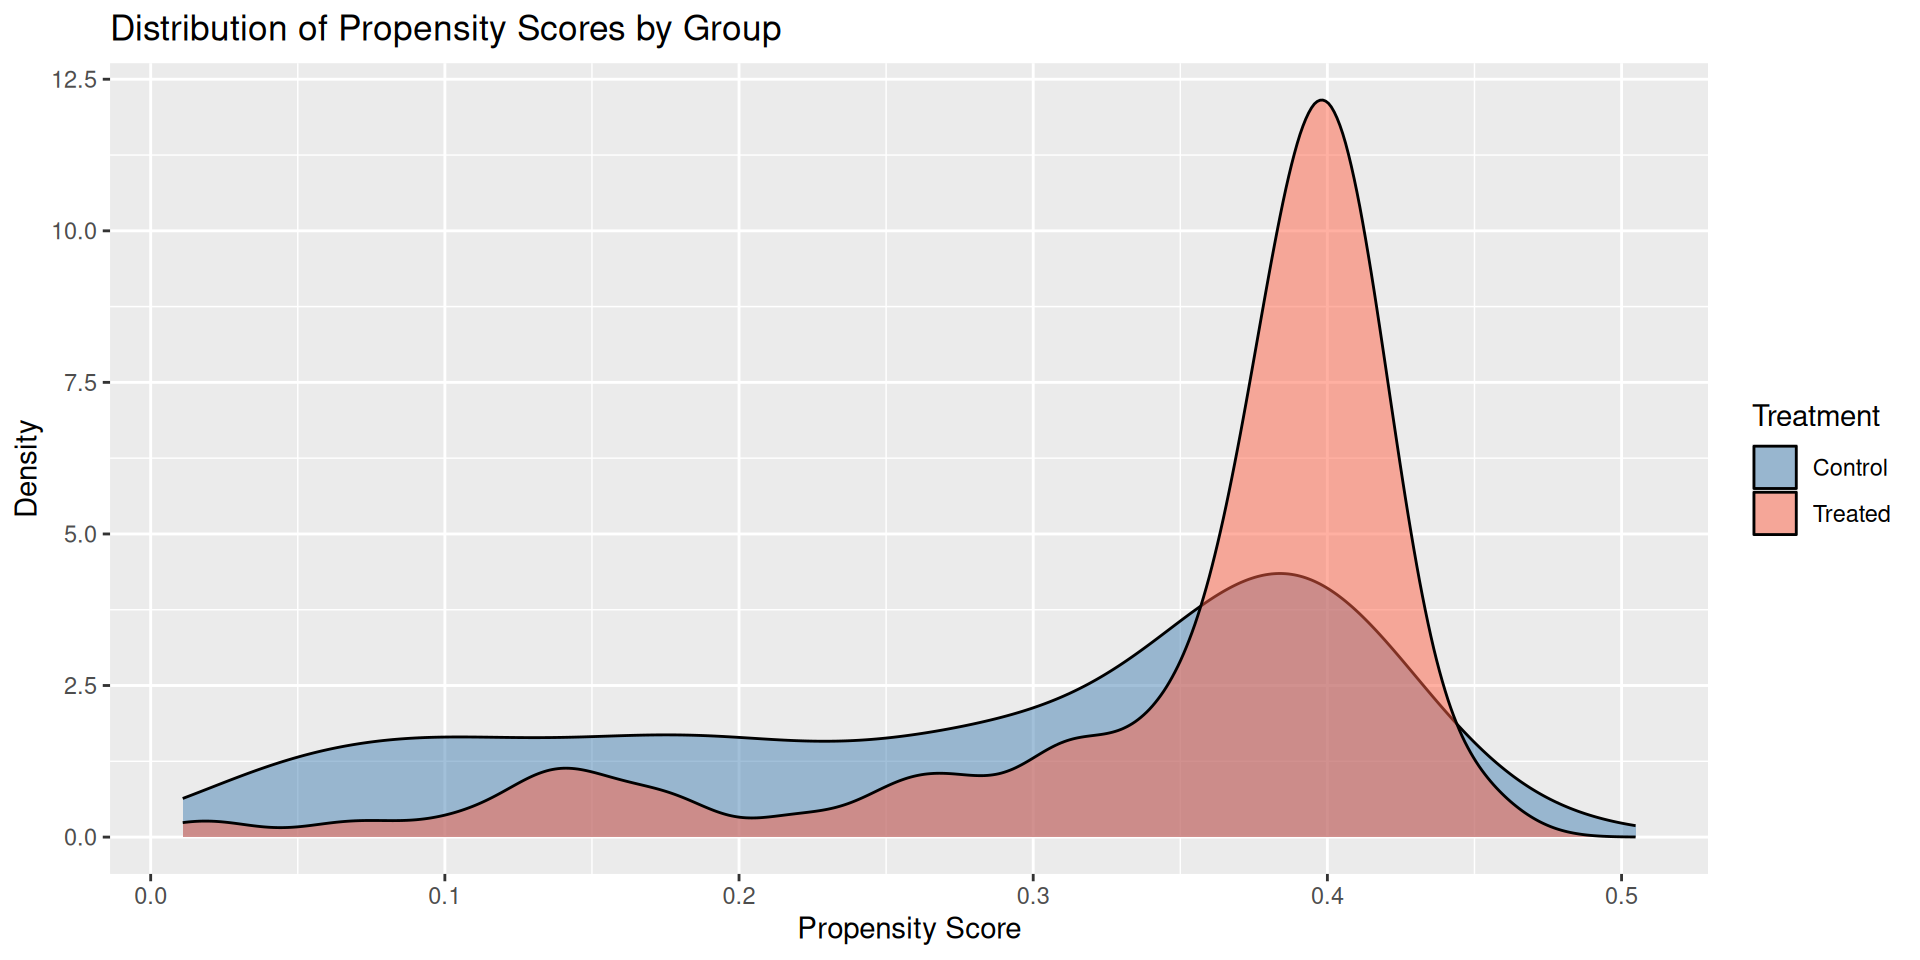
Step 3 & 4: match and check balance
ps_match <- matchit(
  treat ~ age + educ + re74 + re75,
  data     = lalonde,
  method   = "nearest",
  distance = "glm"
)

summary(ps_match, un = FALSE)
Call:
matchit(formula = treat ~ age + educ + re74 + re75, data = lalonde,
    method = "nearest", distance = "glm")

Summary of Balance for Matched Data:
         Means Treated Means Control Std. Mean Diff. Var. Ratio
distance        0.3536        0.3523          0.0141     1.0160
age            25.8162       25.2811          0.0748     0.4690
educ           10.3459       10.4486         -0.0511     0.6392
re74         2095.5737     2137.7507         -0.0086     1.2576
re75         1532.0553     1385.2355          0.0456     1.7520
         eCDF Mean eCDF Max Std. Pair Dist.
distance    0.0088   0.0757          0.0179
age         0.0801   0.2486          1.4014
educ        0.0208   0.0973          1.0673
re74        0.0365   0.2541          0.1778
re75        0.0379   0.1946          0.6412

Sample Sizes:
          Control Treated
All           429     185
Matched       185     185
Unmatched     244       0
Discarded       0       0
Step 5: estimate the treatment effect
# A tibble: 2 × 5
  term        estimate std.error statistic  p.value
  <chr>          <dbl>     <dbl>     <dbl>    <dbl>
1 (Intercept)    5988.      533.    11.2   2.38e-25
2 treat           362.      754.     0.479 6.32e- 1
After propensity score matching, we have a valid causal estimate (under no unmeasured confounders)
This scales to many covariates, unlike direct covariate matching
Always check balance after matching. If balance is poor, improve the propensity score model
Limitations of observational studies
No unmeasured confounders: the key assumption is untestable. If an important confounder is missing from \(X\), our estimate is still biased
Bad controls: only include pre-treatment variables in \(X\). Never include variables caused by \(Z\)
Model dependence: the propensity score model matters. Wrong specification leads to poor balance and biased estimates
RCTs are still the gold standard; observational methods are our best option when experiments are impossible
Key takeaways
Observational studies require careful adjustment for confounders \(X\)
Covariate matching: find control units similar on \(X\) directly. Works well with few covariates
Propensity score matching: match on \(P(Z = 1 \mid X)\). Scales to high dimensions
Both require no unmeasured confounders, an assumption that must be argued for, not tested from data
Now you have two tools to draw causal conclusions!