Welcome to STA 199!
Lecture 0
June 29, 2026
Where’s this?

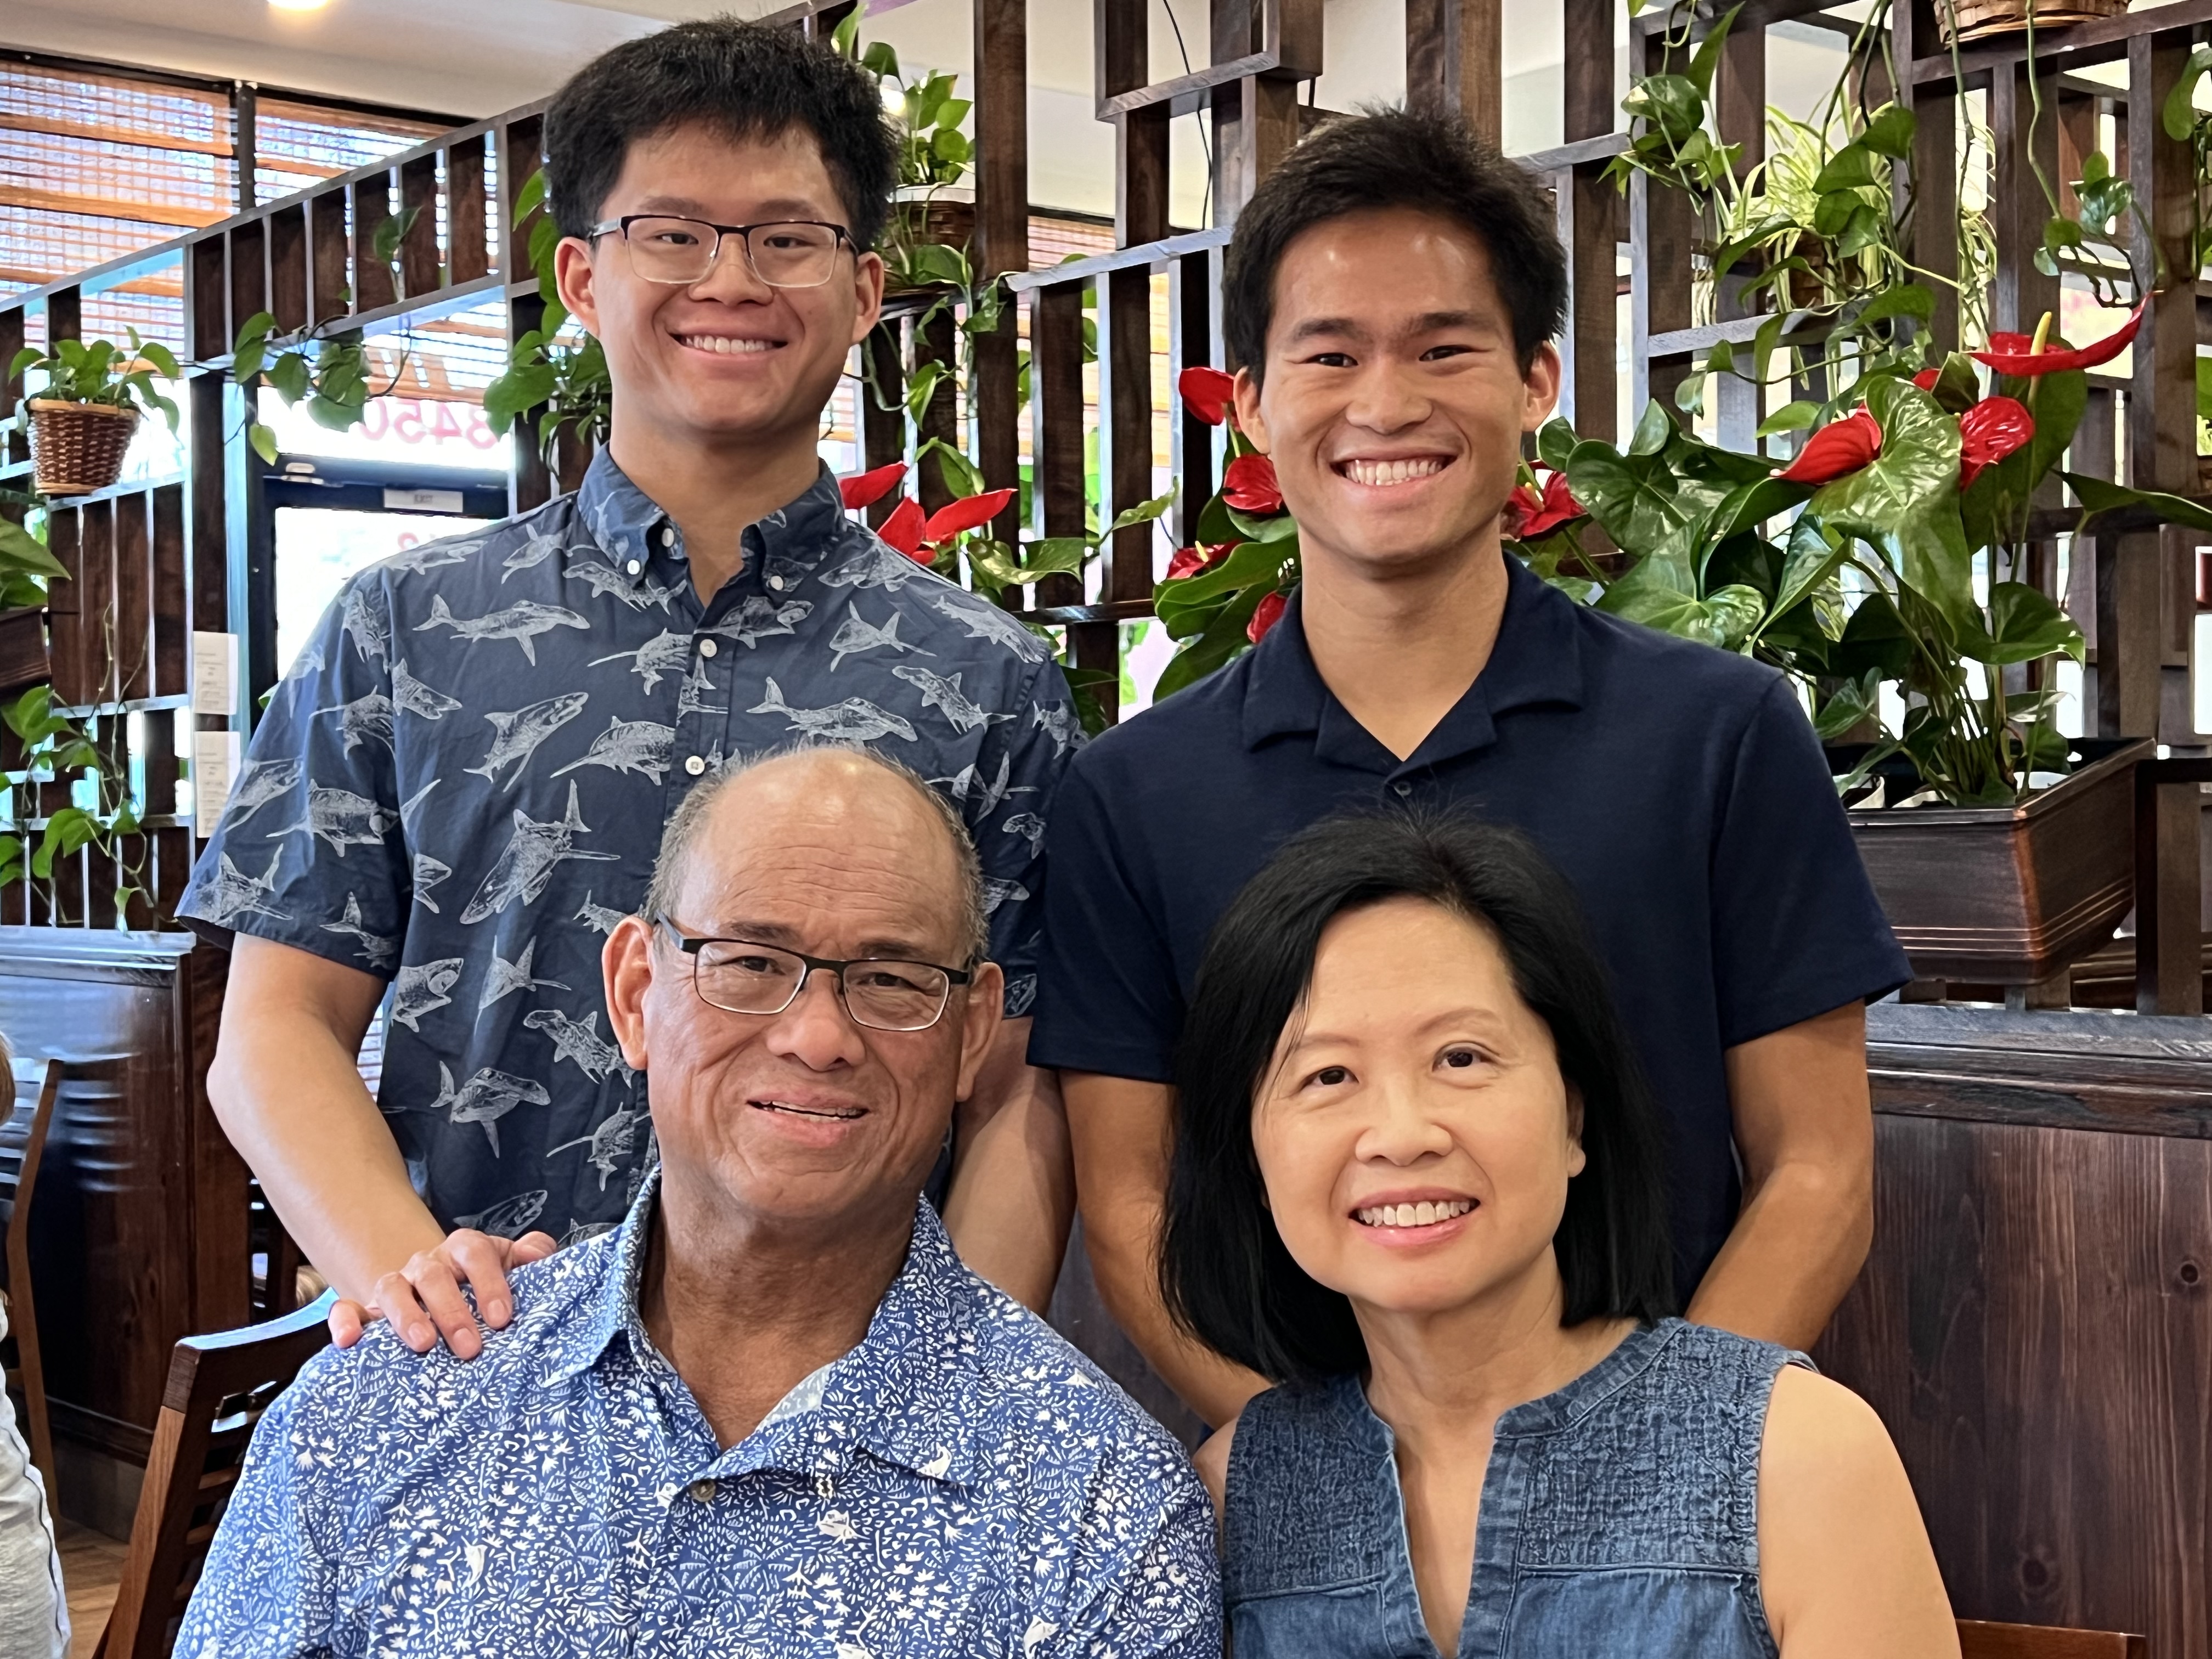
My family
UCLA


- UCLA! Majored in applied mathematics, statistics and data science
- Graduated 2024
- Did research, blah blah blah blah blah, wanted more school etc.
UCLA cont


DUKE
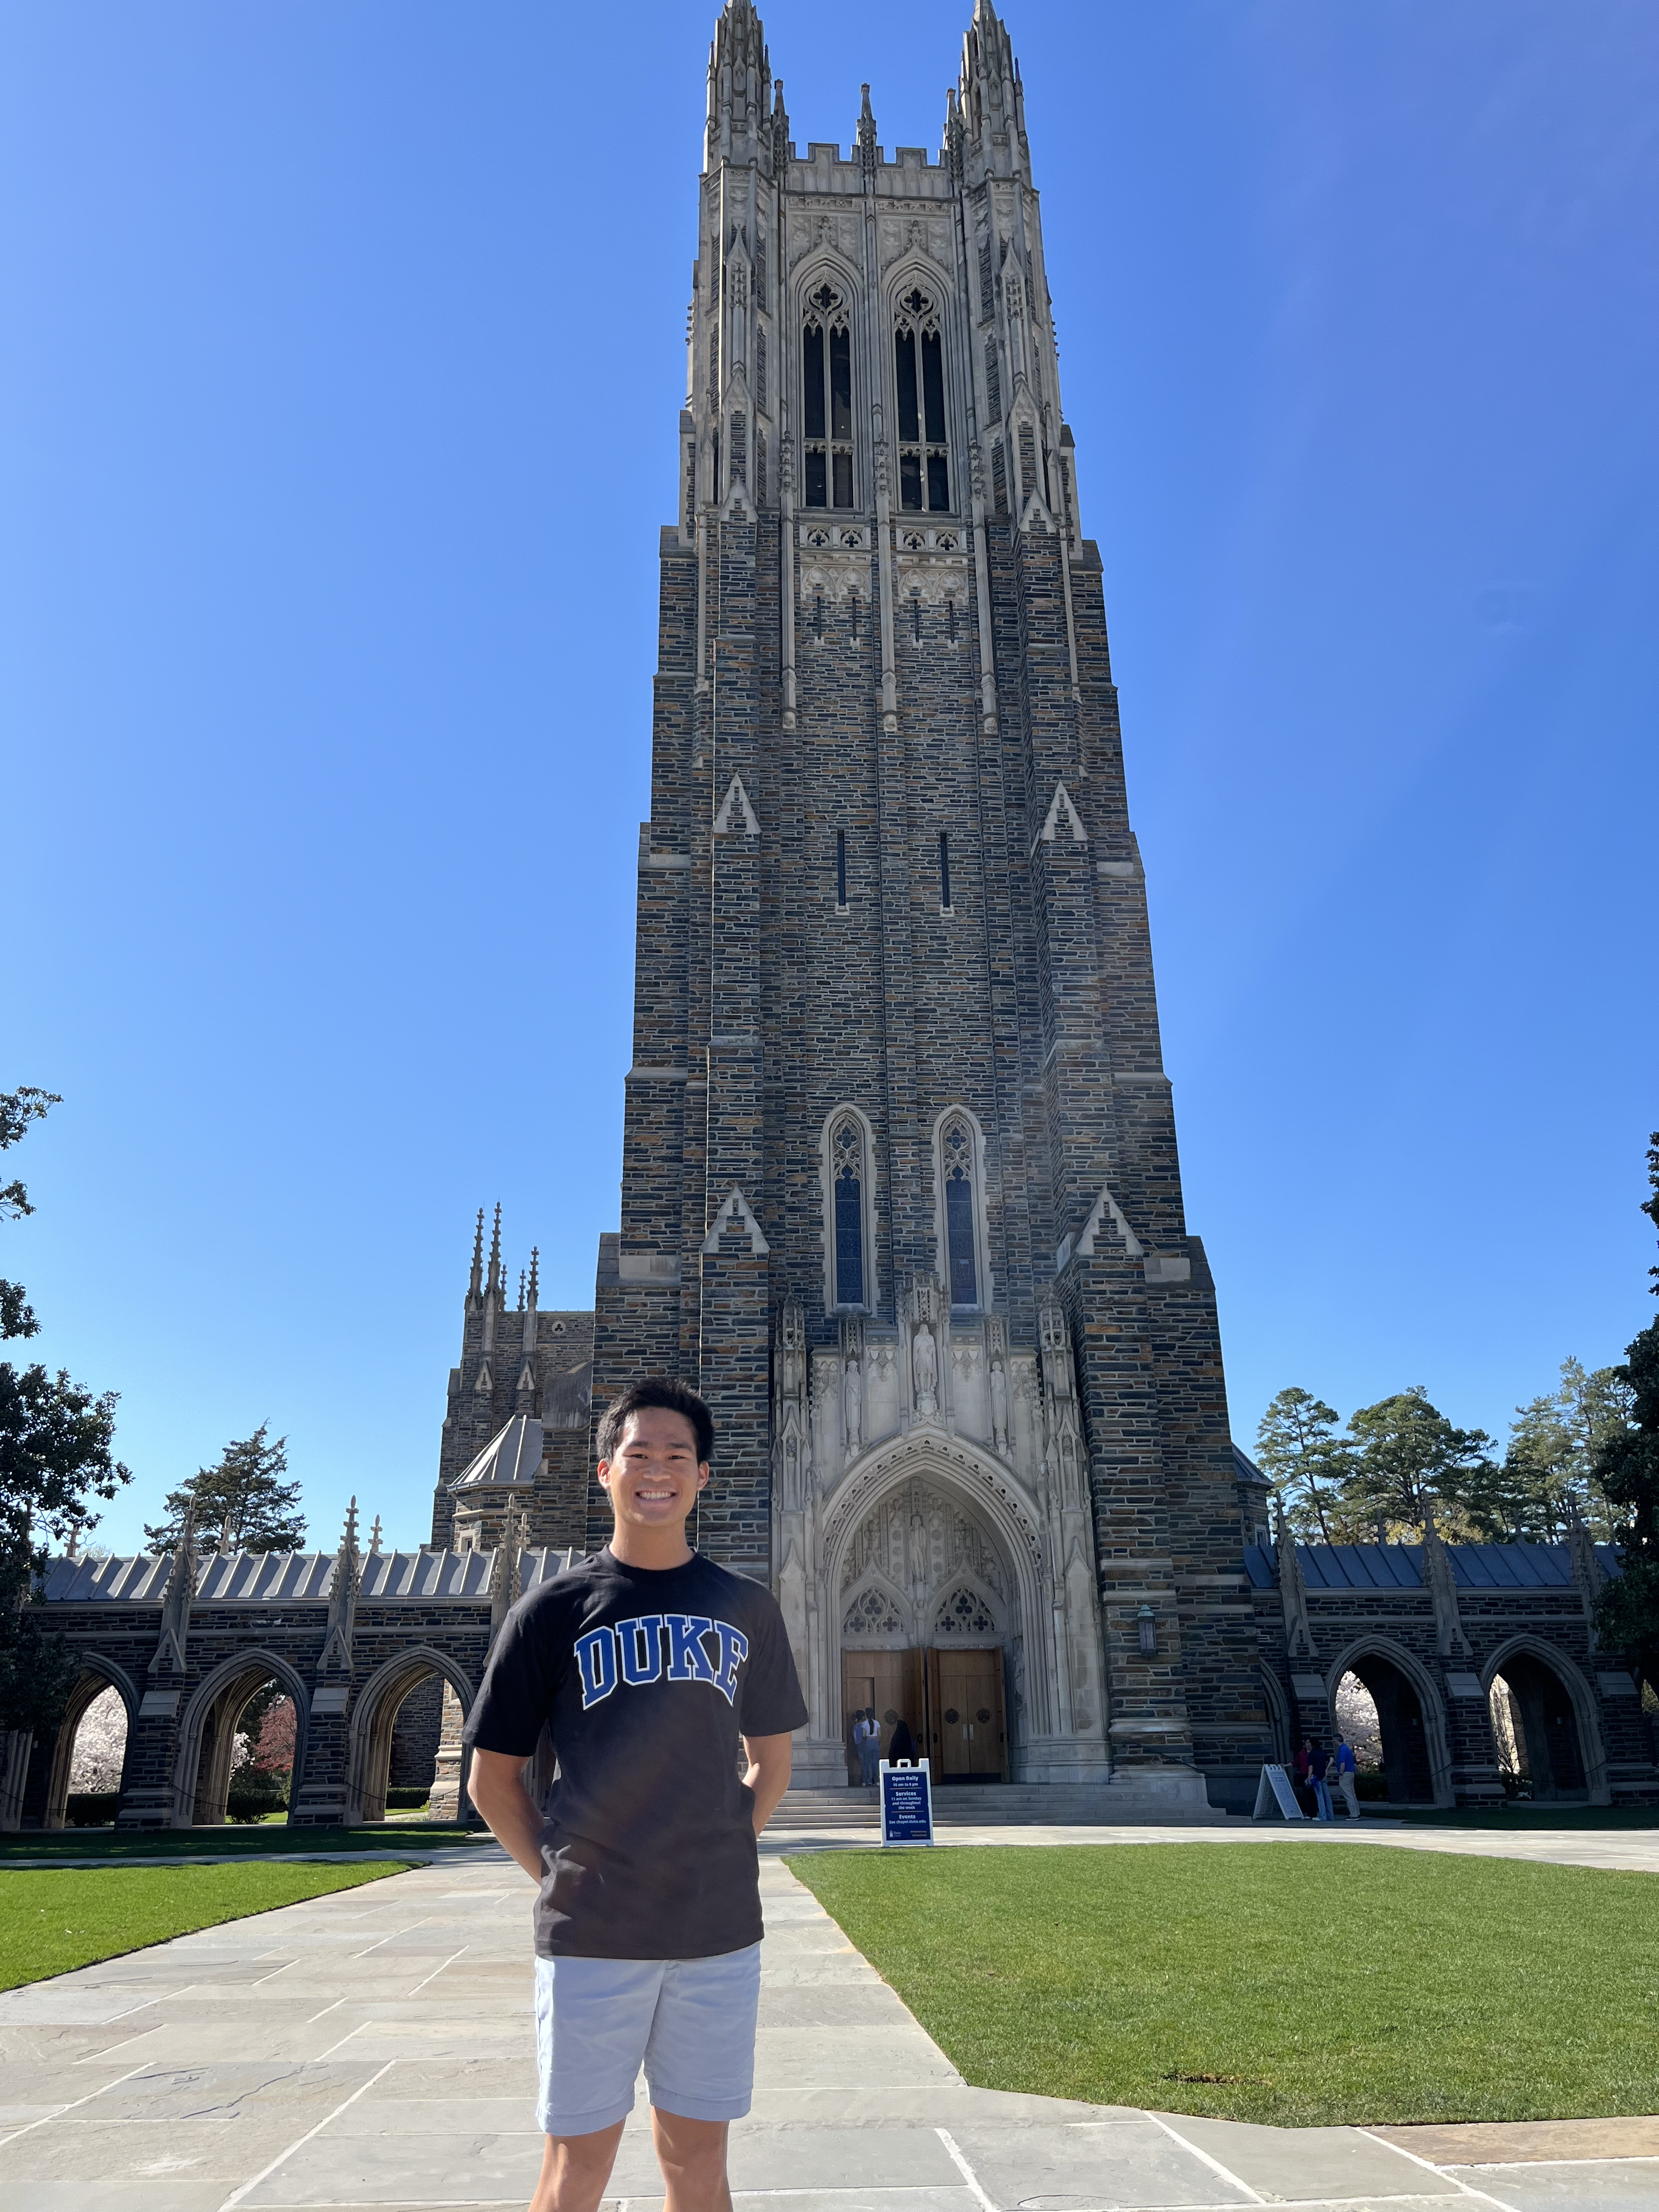

- PhD in statistical science
- Research in causal inference, missing data, and machine learning
- Applied projects across multiple medical schools
Duke cont

Who can explain this?

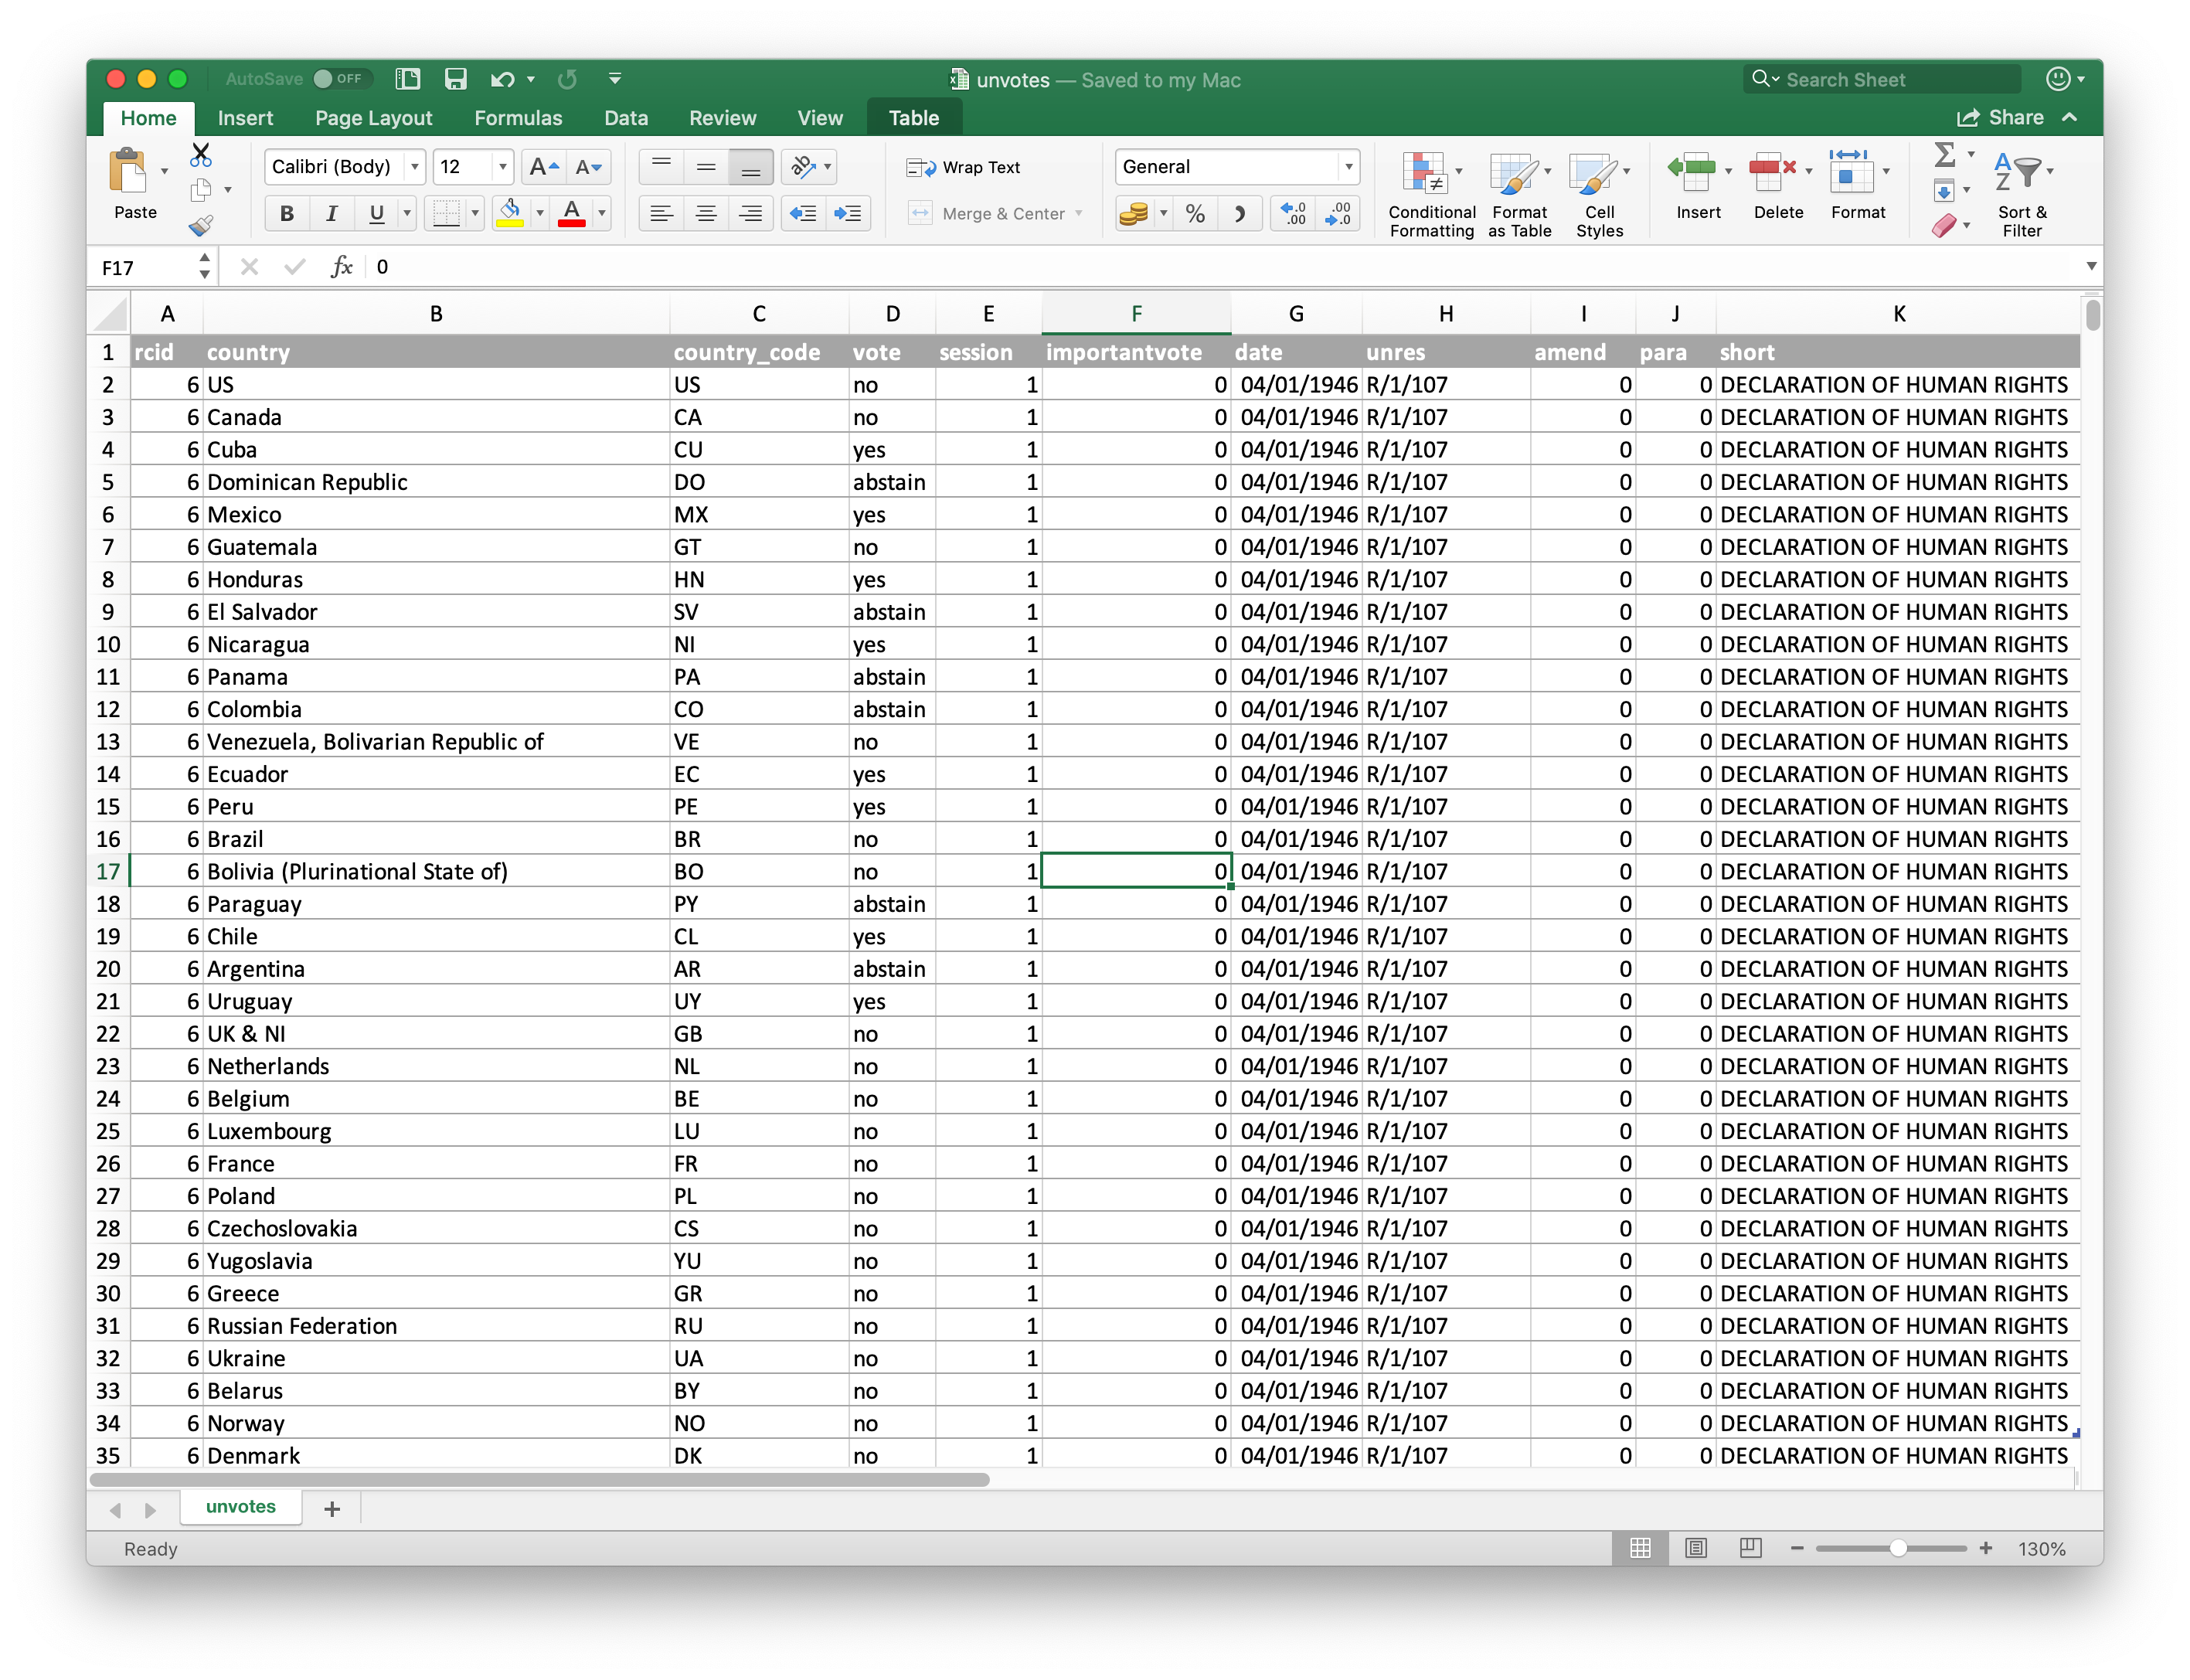
Excel… 👎
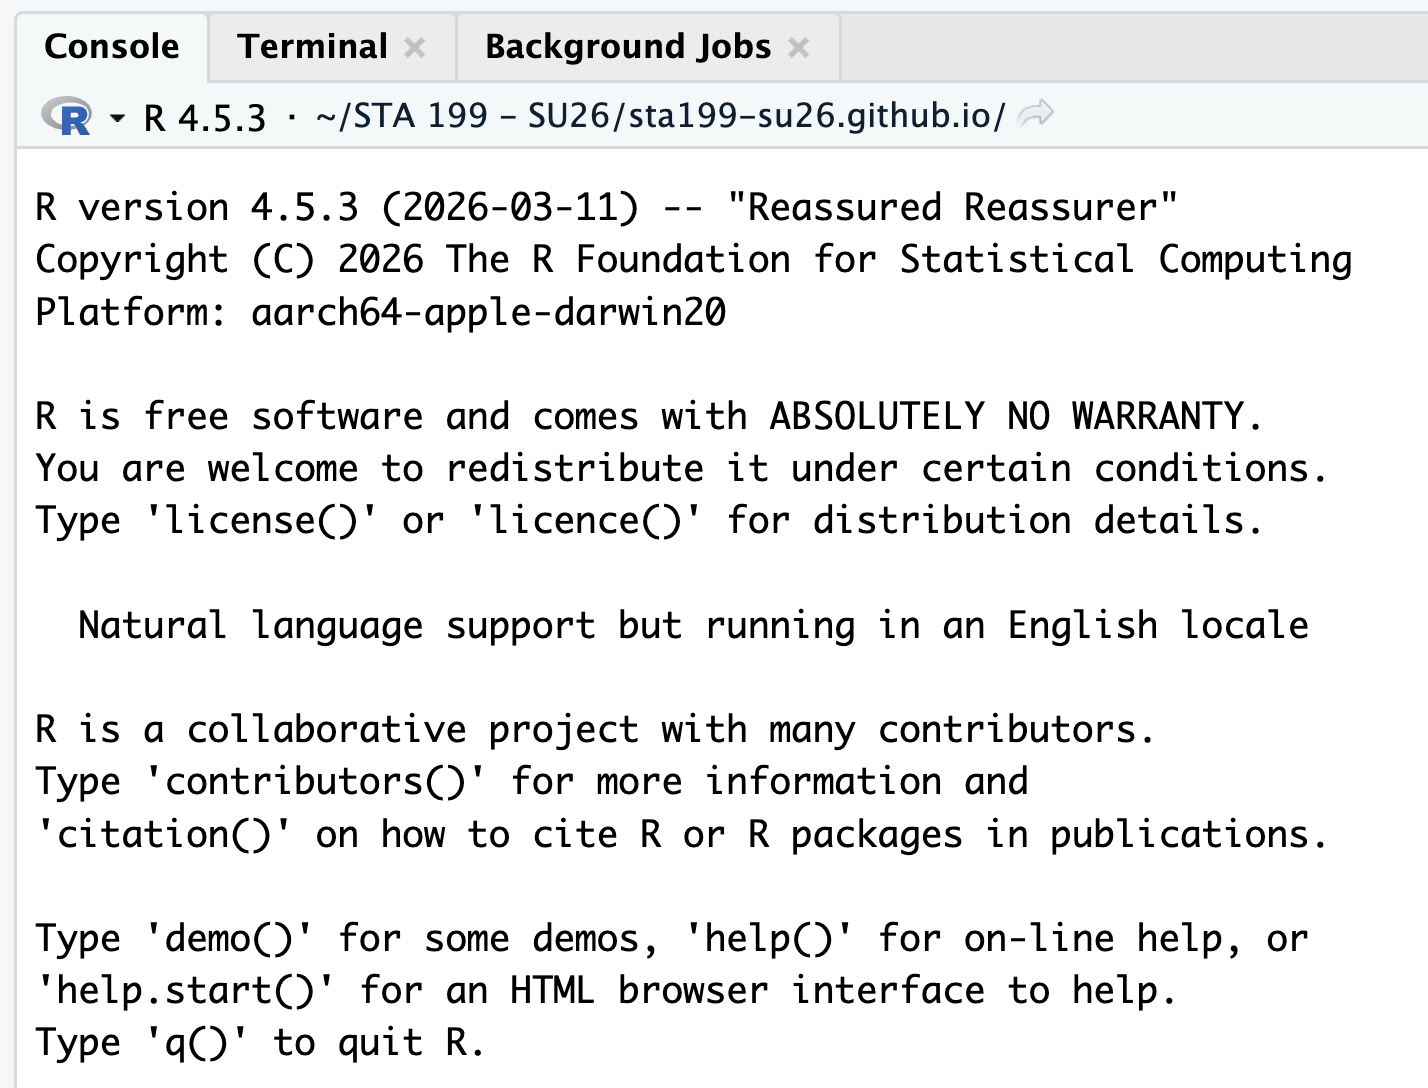
R
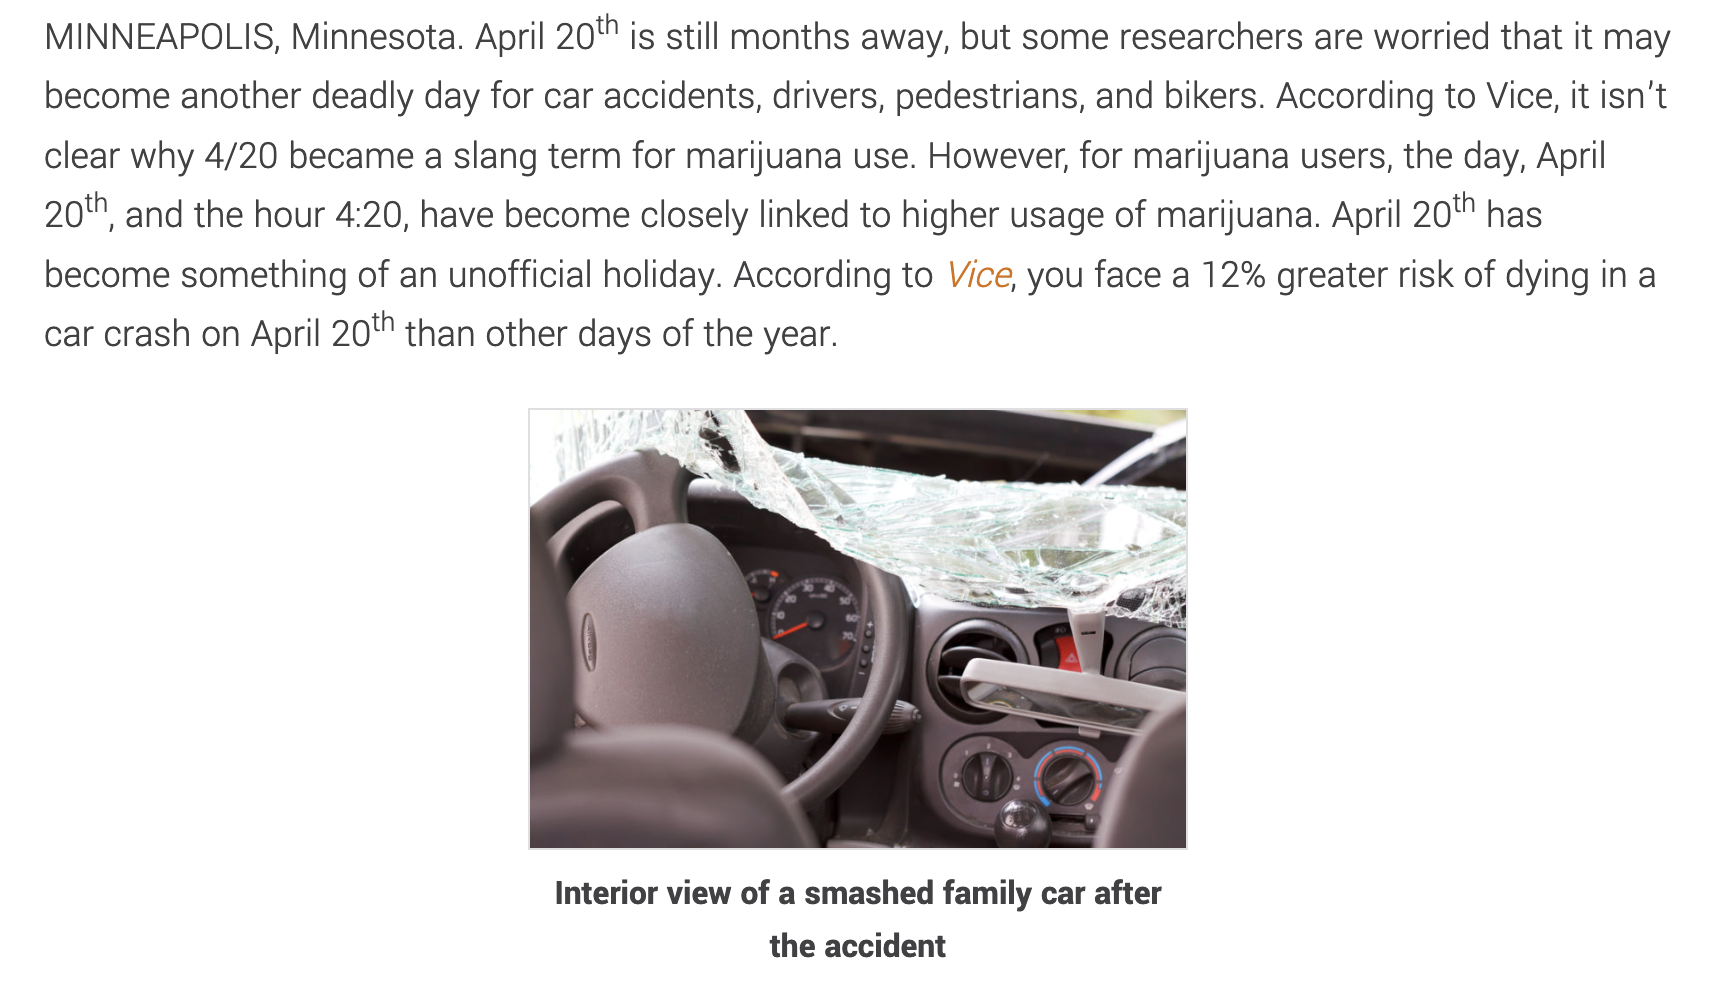
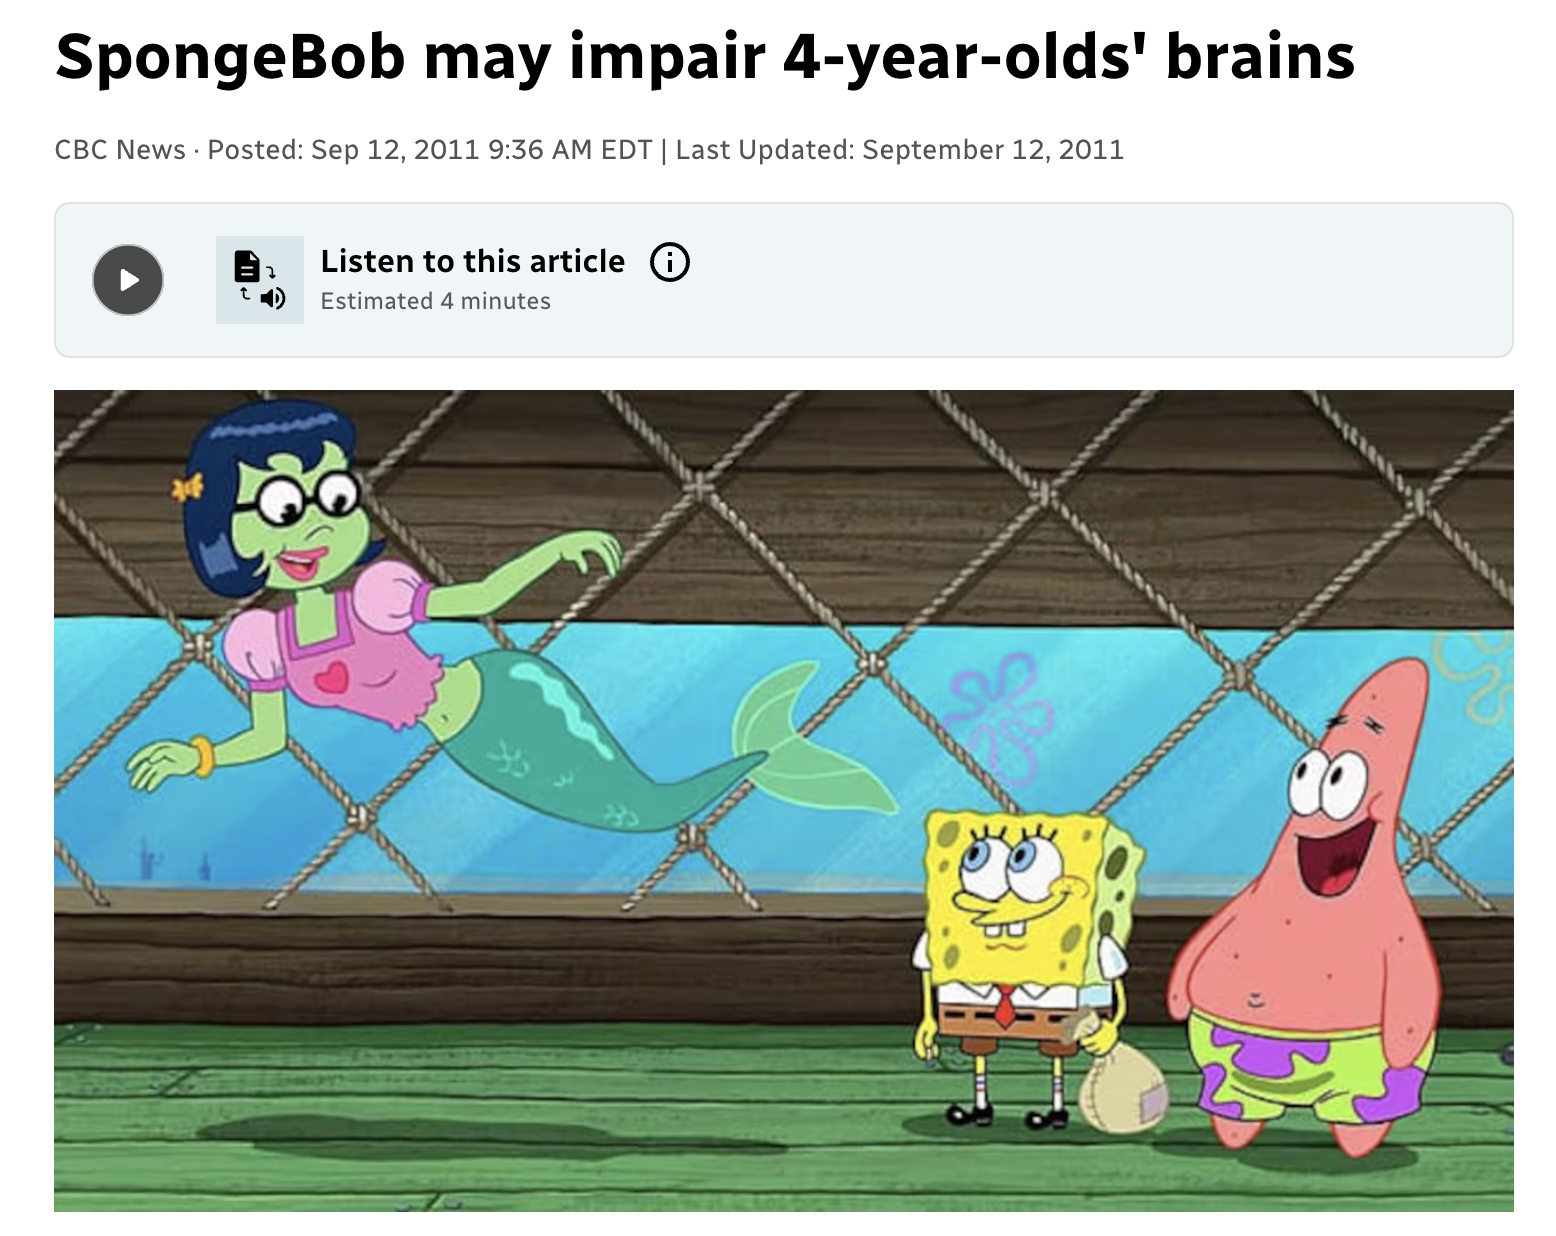
“April 20th: Deadly Day for Car Crashes?”
The text below can be found at this link, which is a post on the website of a personal injury law firm. Suppose we want to investigate the validity of their claim… What data might we want? What methods are appropriate? How will we perform our analysis? How can we best communicate our findings?
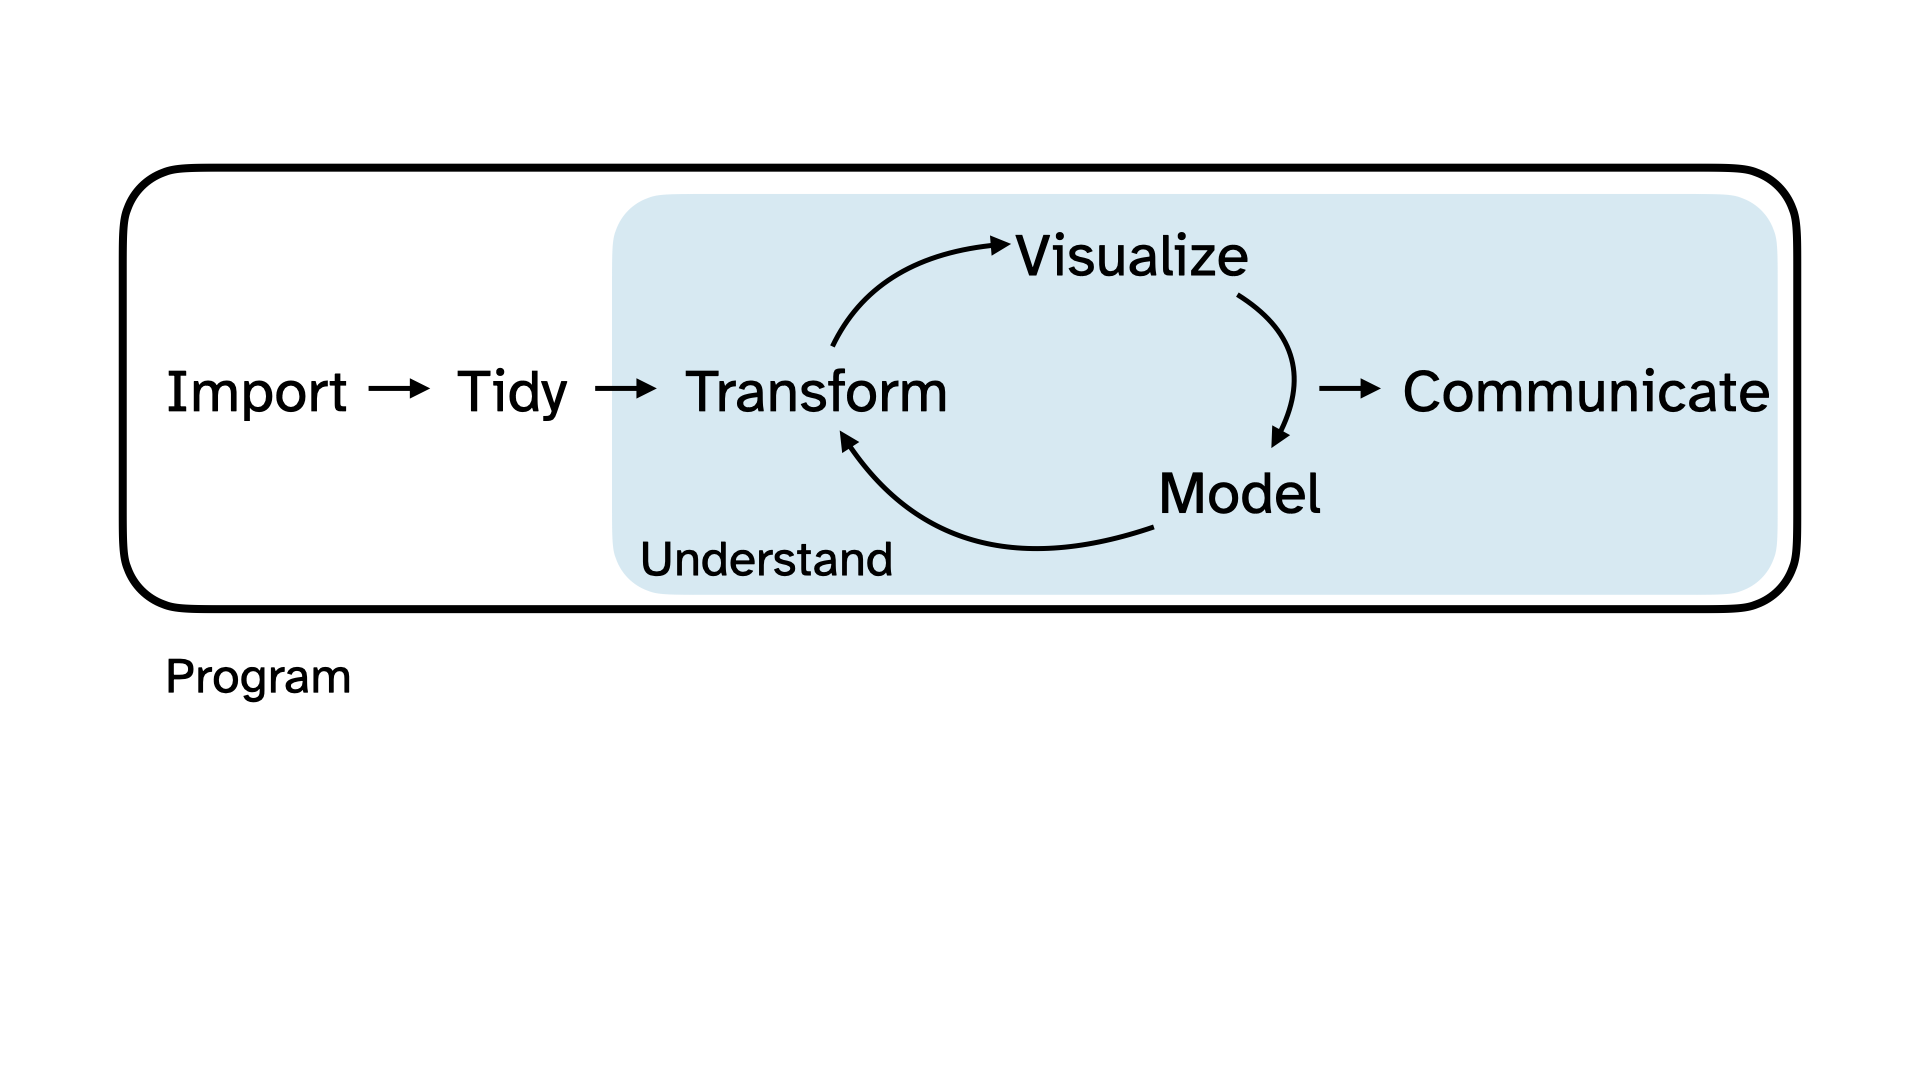
The data science life cycle
The data science life cycle
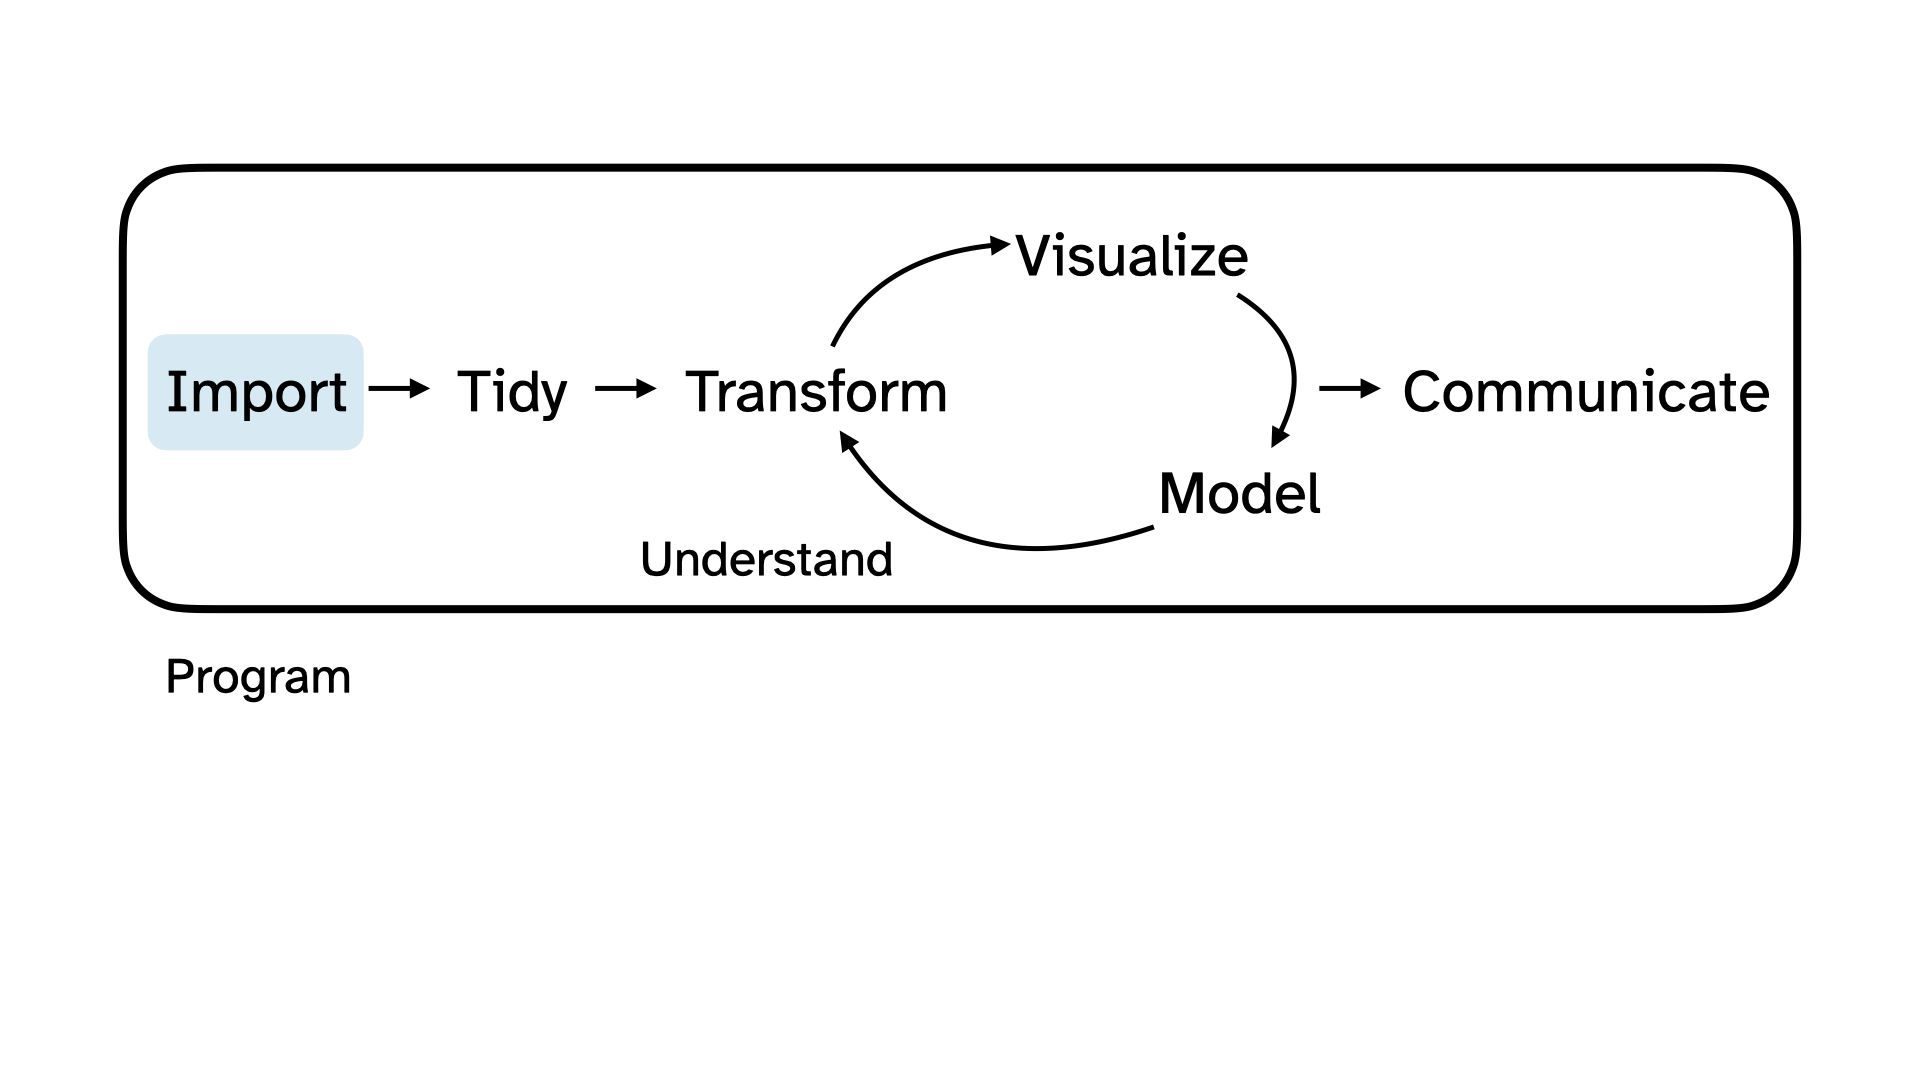
The data science life cycle
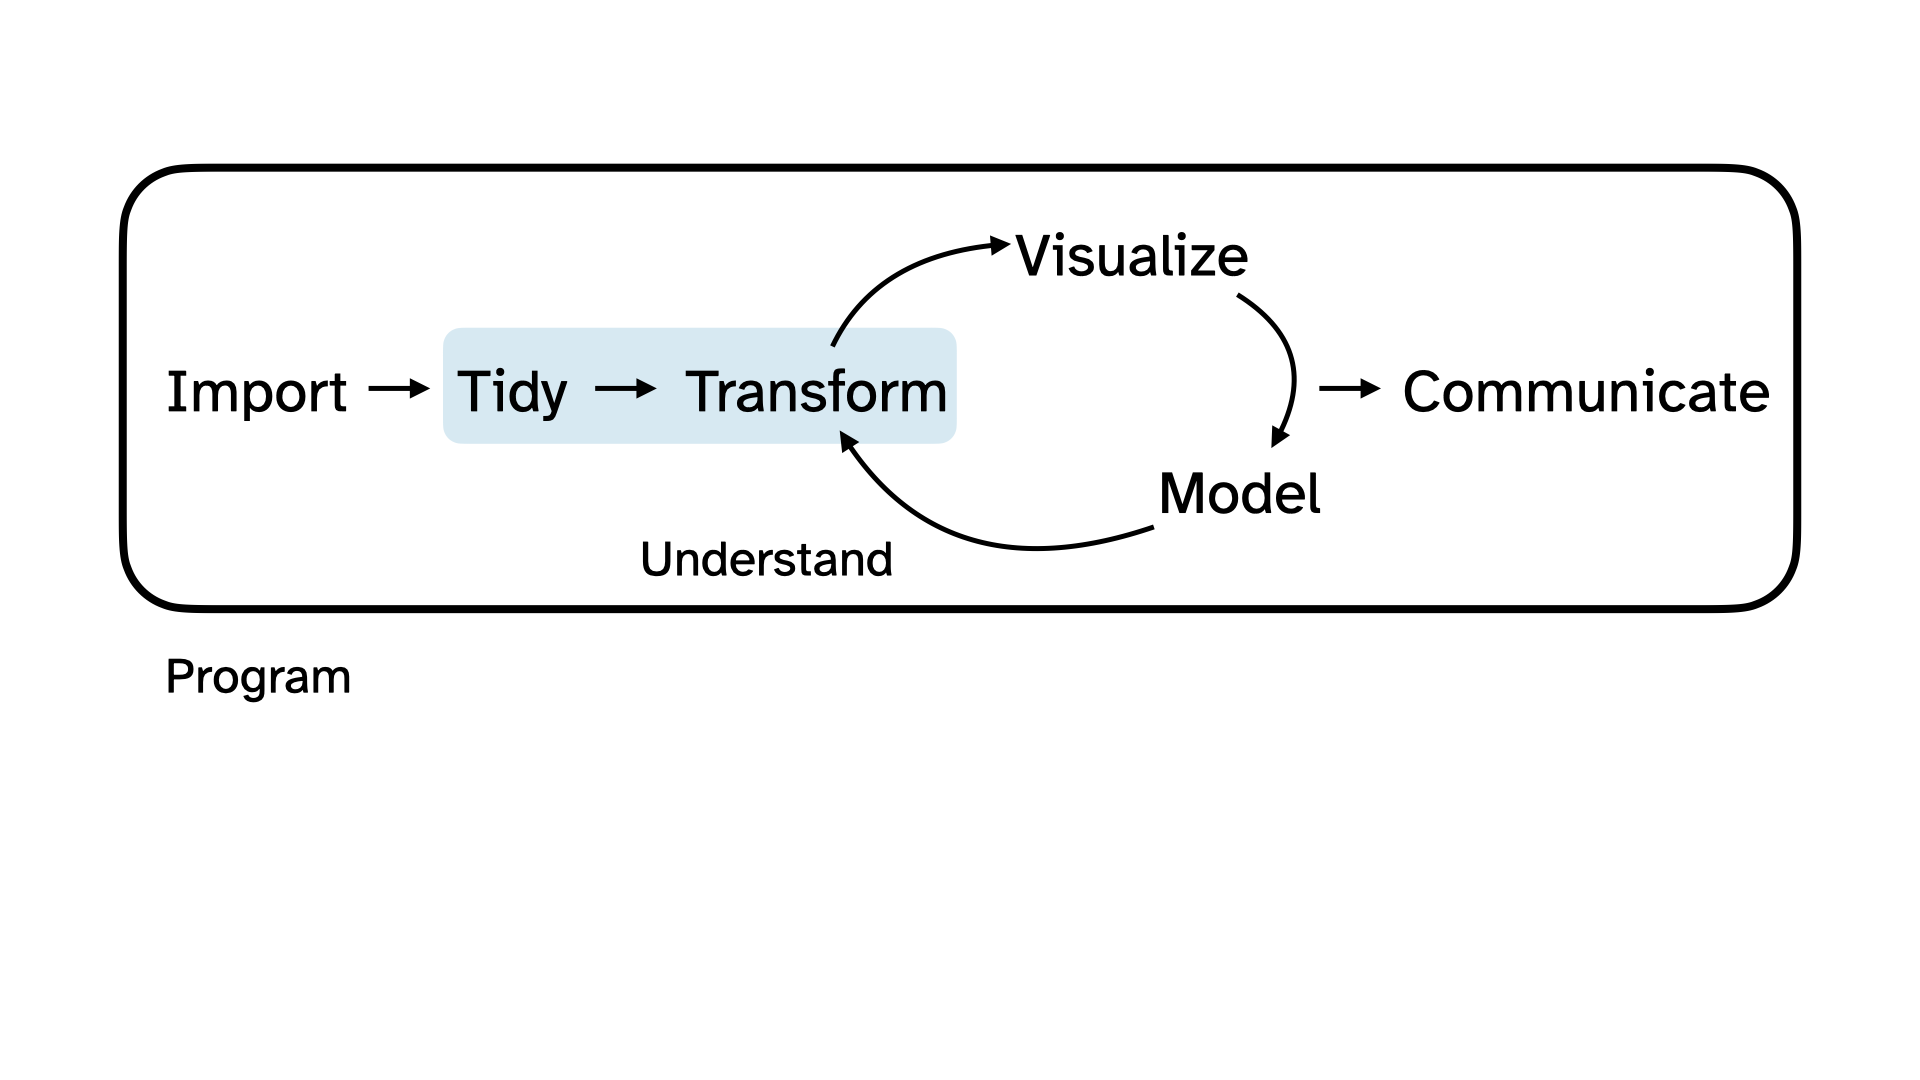
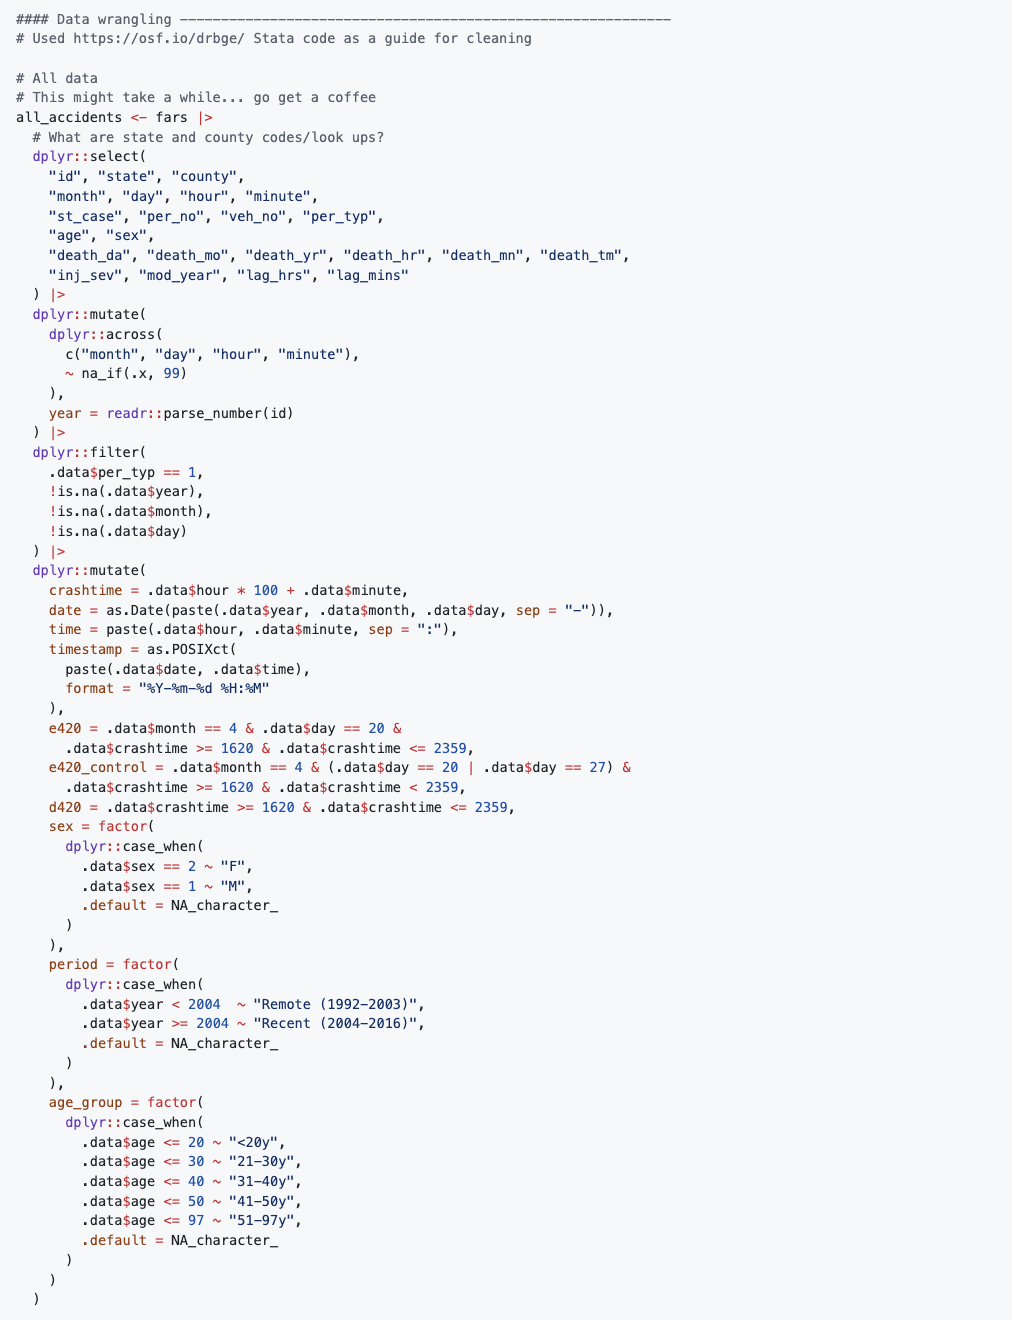
If we hadn’t had access to our tidy data…
The data science life cycle
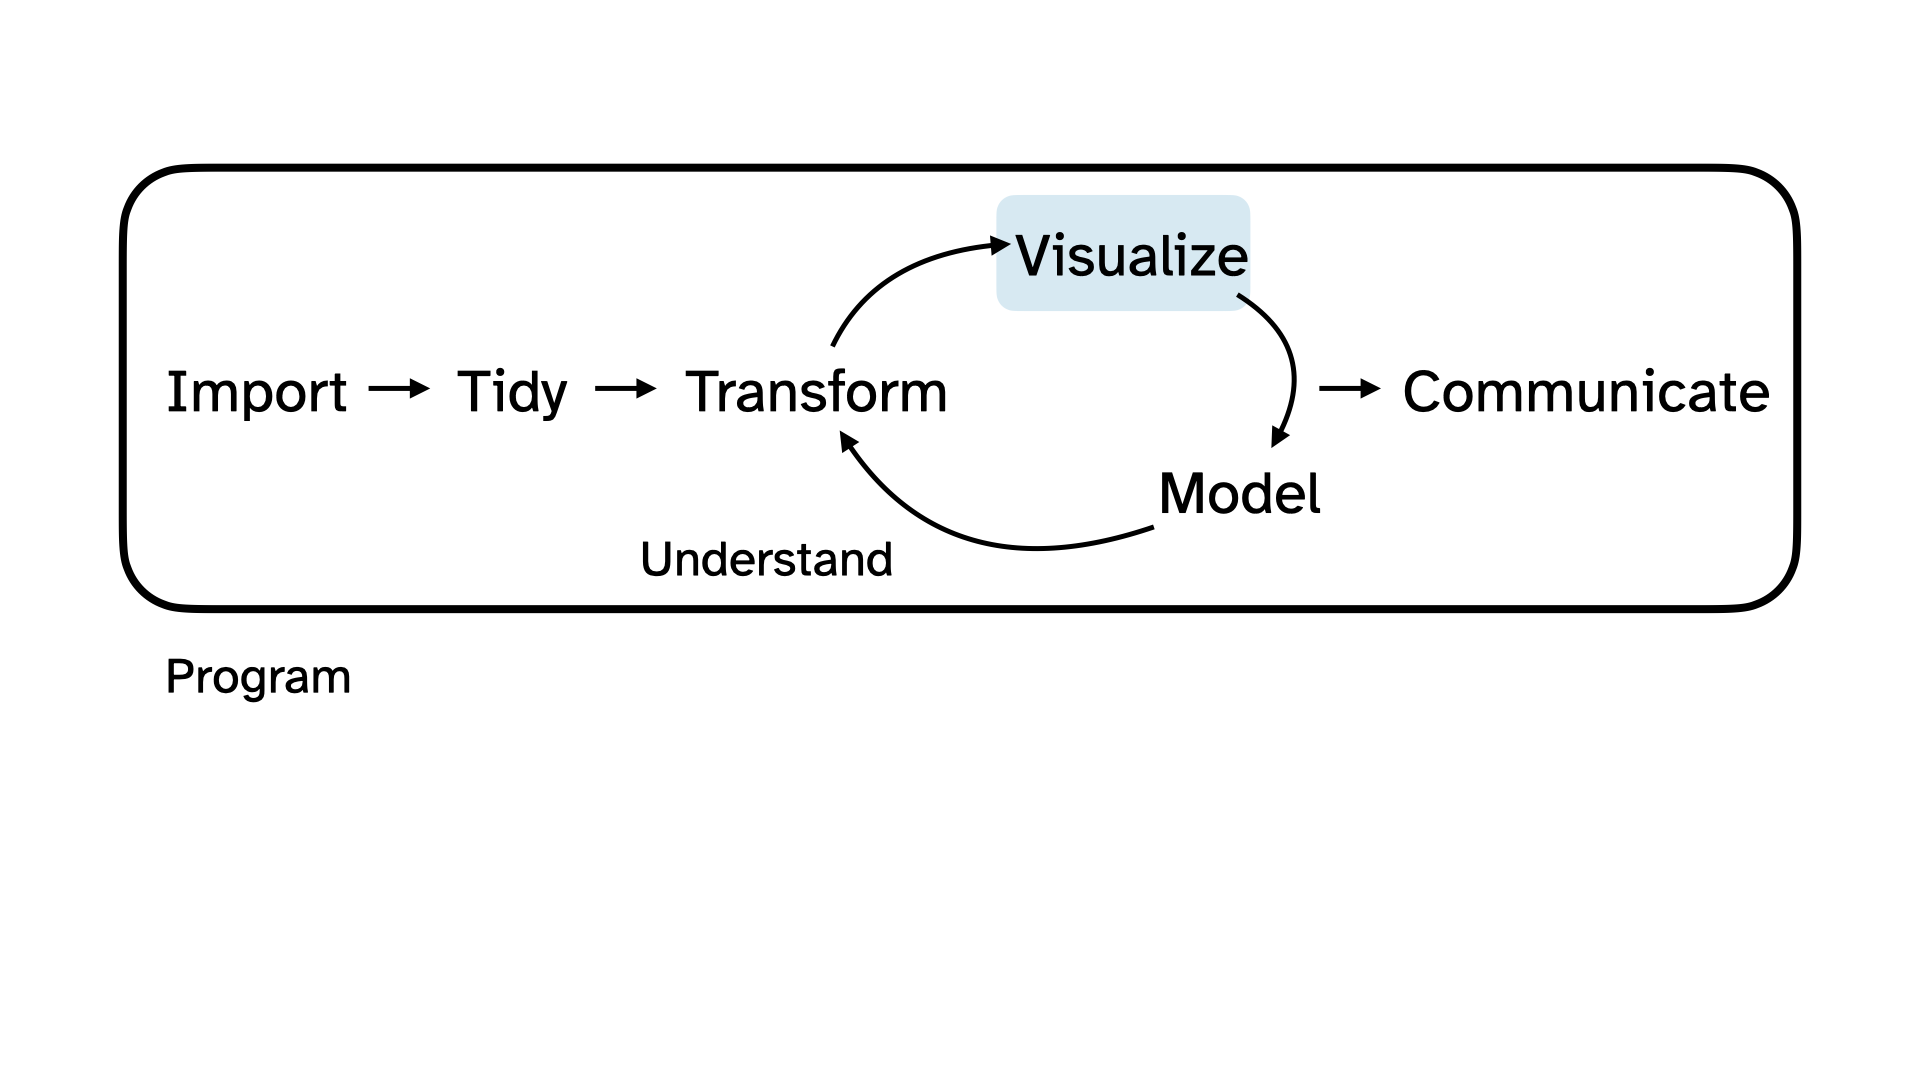
Baby’s first graphic
Baby’s first graphic
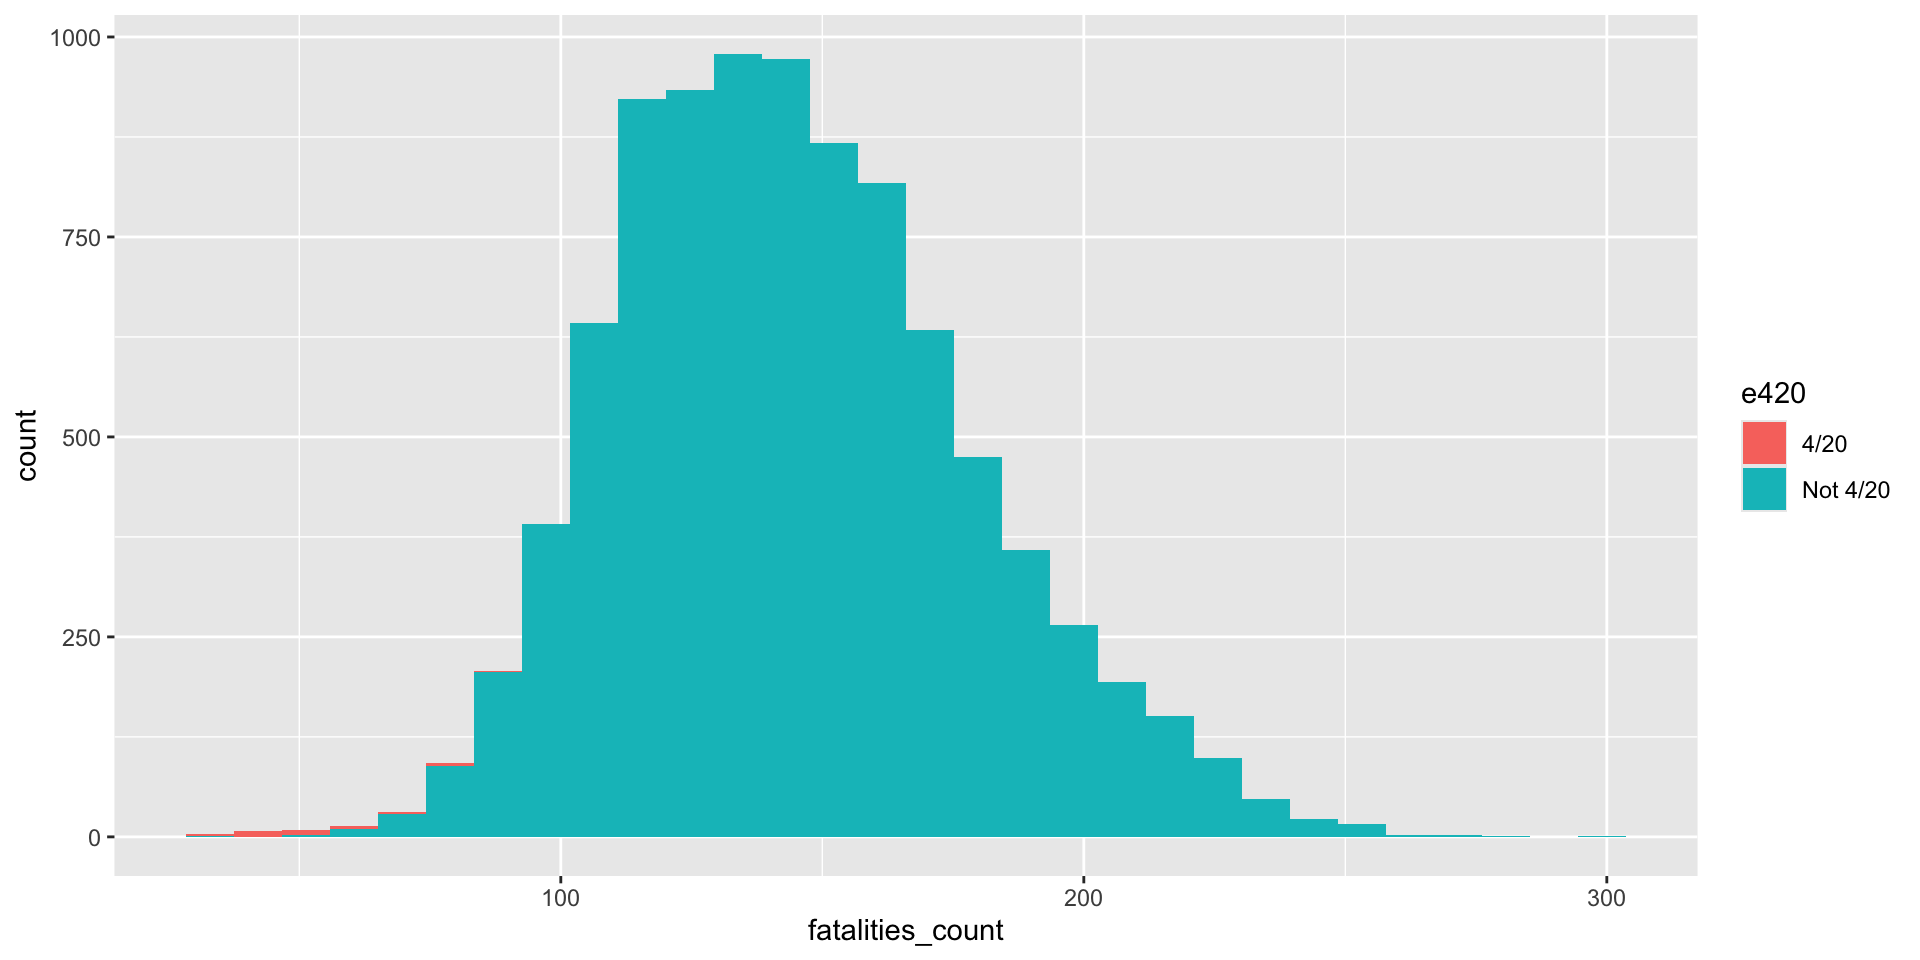
Baby’s first graphic
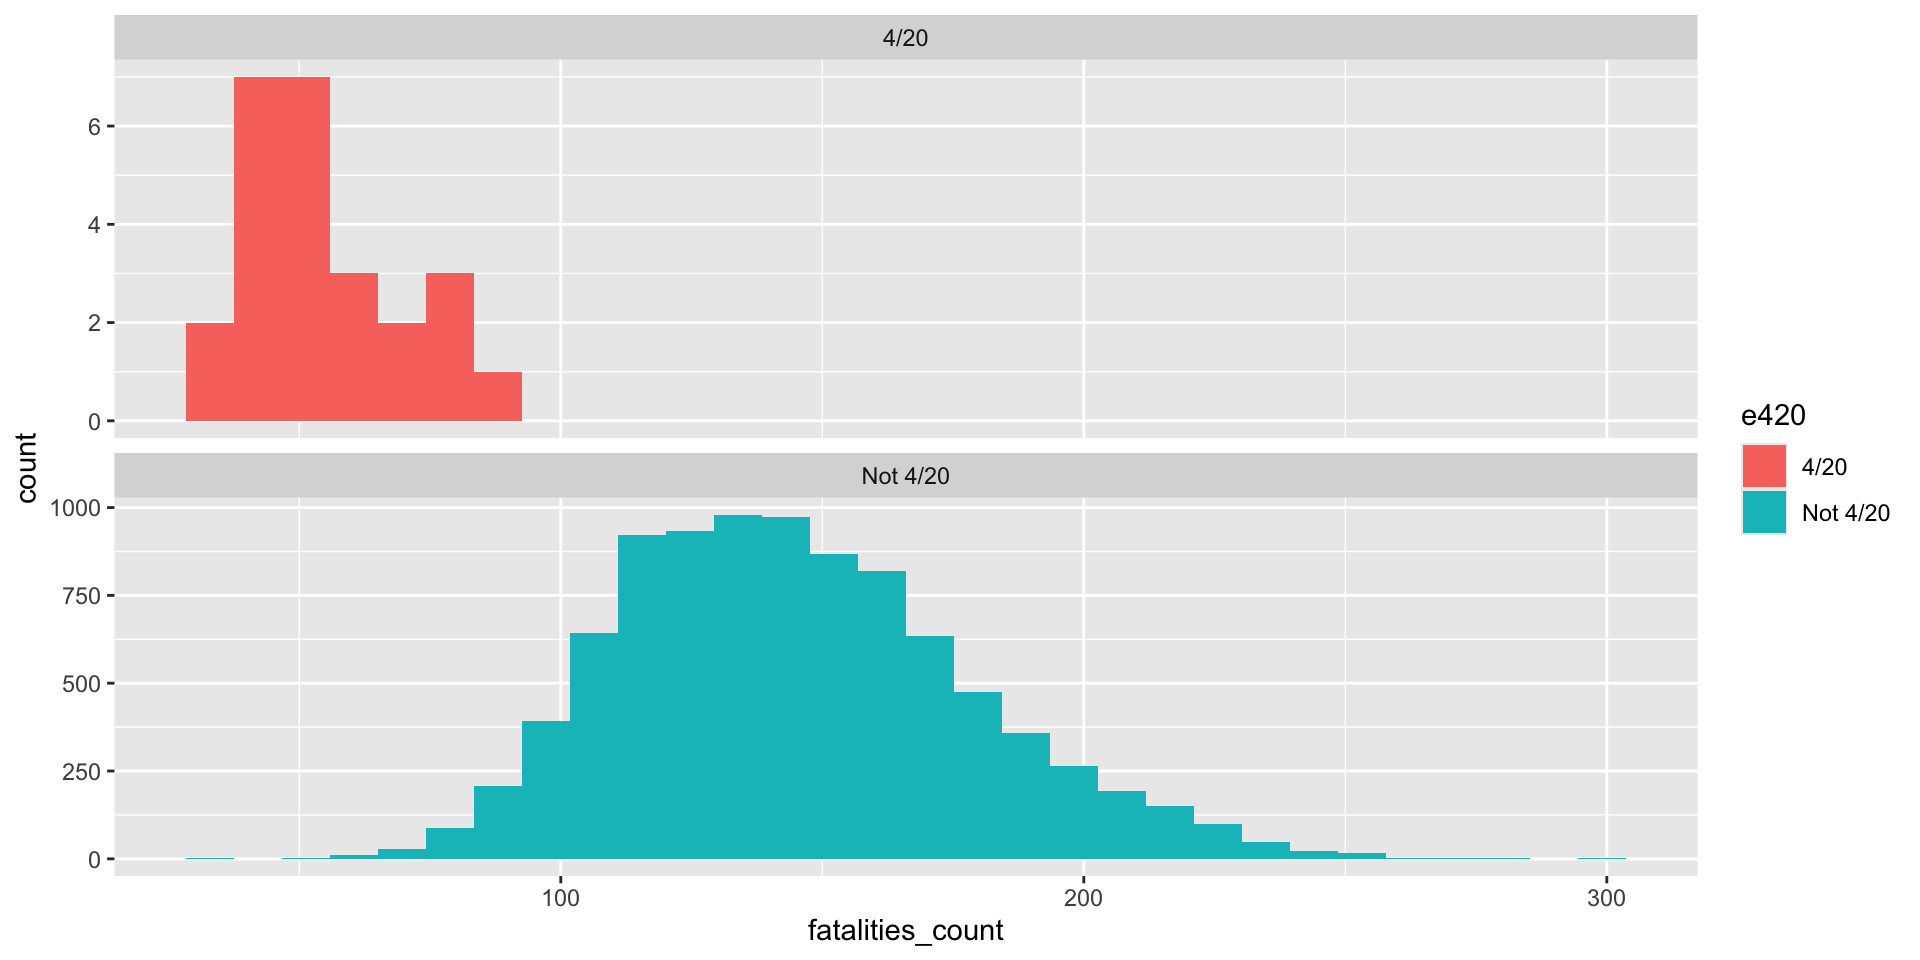
Baby’s first graphic
ggplot(daily_accidents_420, aes(fatalities_count, fill = e420)) +
geom_histogram() +
facet_wrap(~ e420, ncol = 1, scales = "free_y") +
labs(title = "Histogram of Daily Traffic Accident Fatality Count, 1992-2016",
subtitle = "On the 'High Holiday' (4/20), vs. Not",
x = "Daily Traffic Accident Fatality Count (1992 - 2016)",
y = "Count of Observations") +
theme_minimal() +
theme(legend.position = "none") 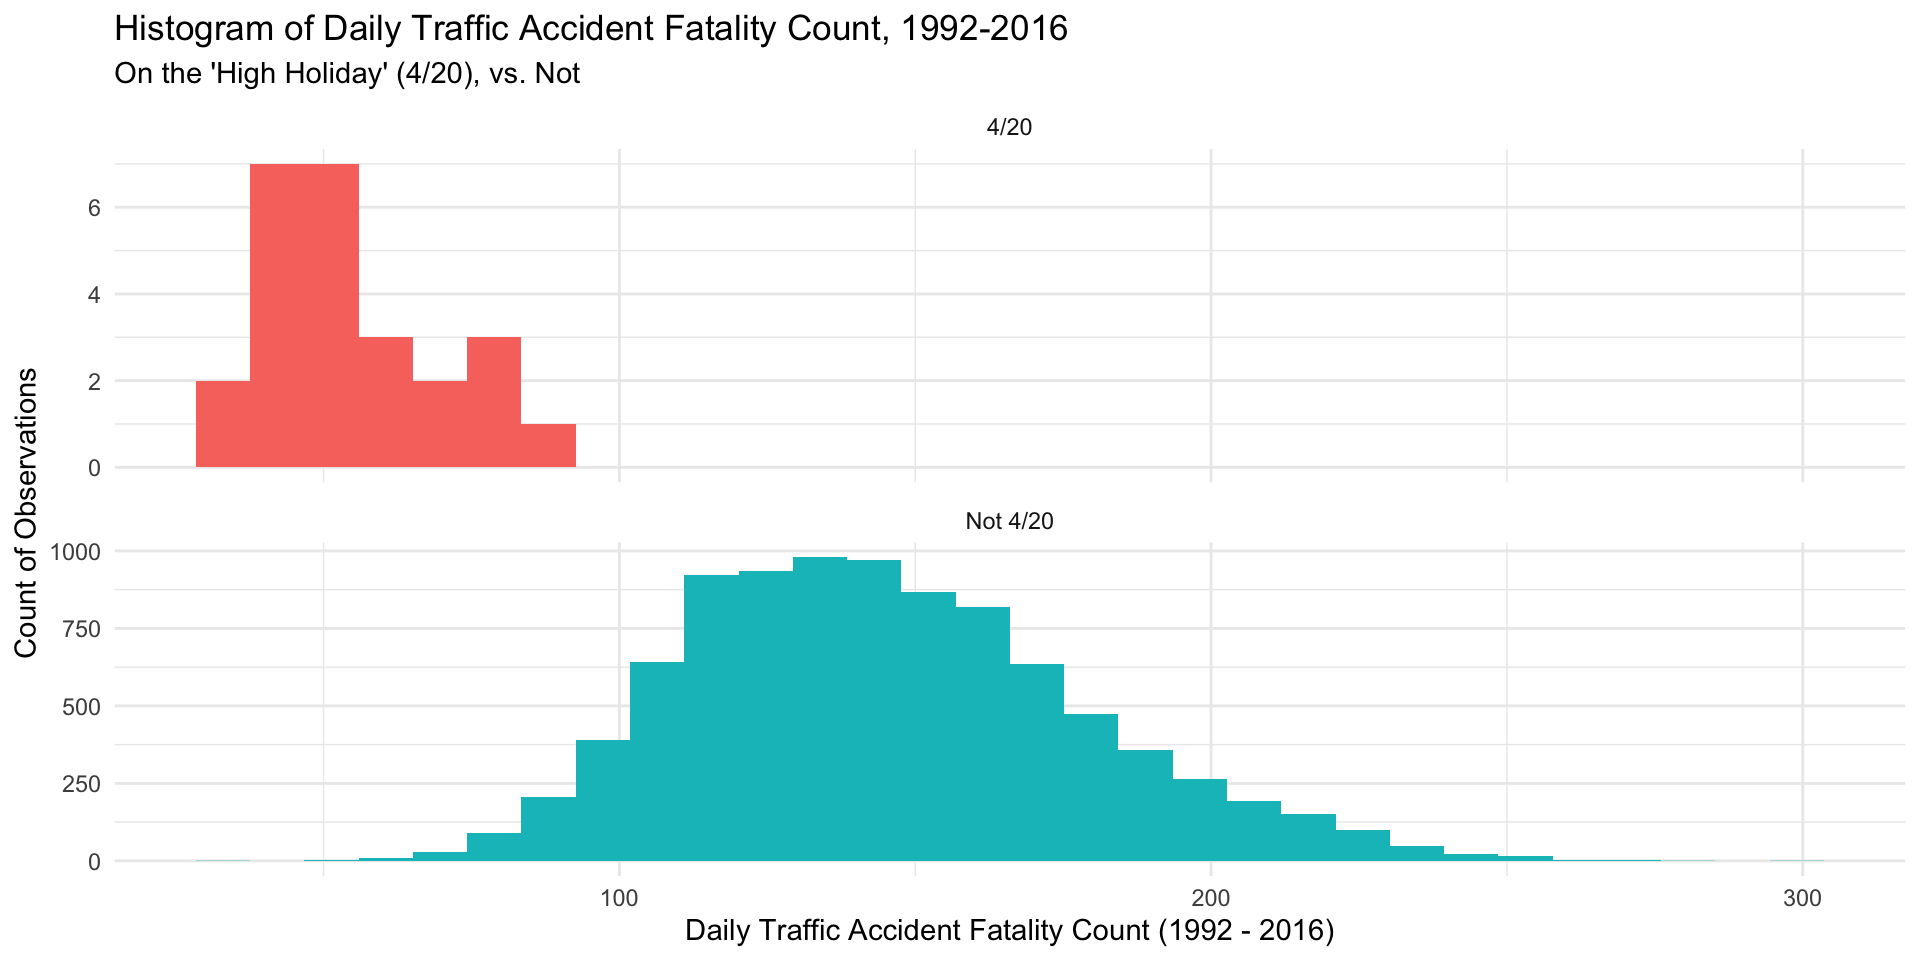
The data science life cycle
In reality…

POV: Your Mom dropped this banger in the family gc
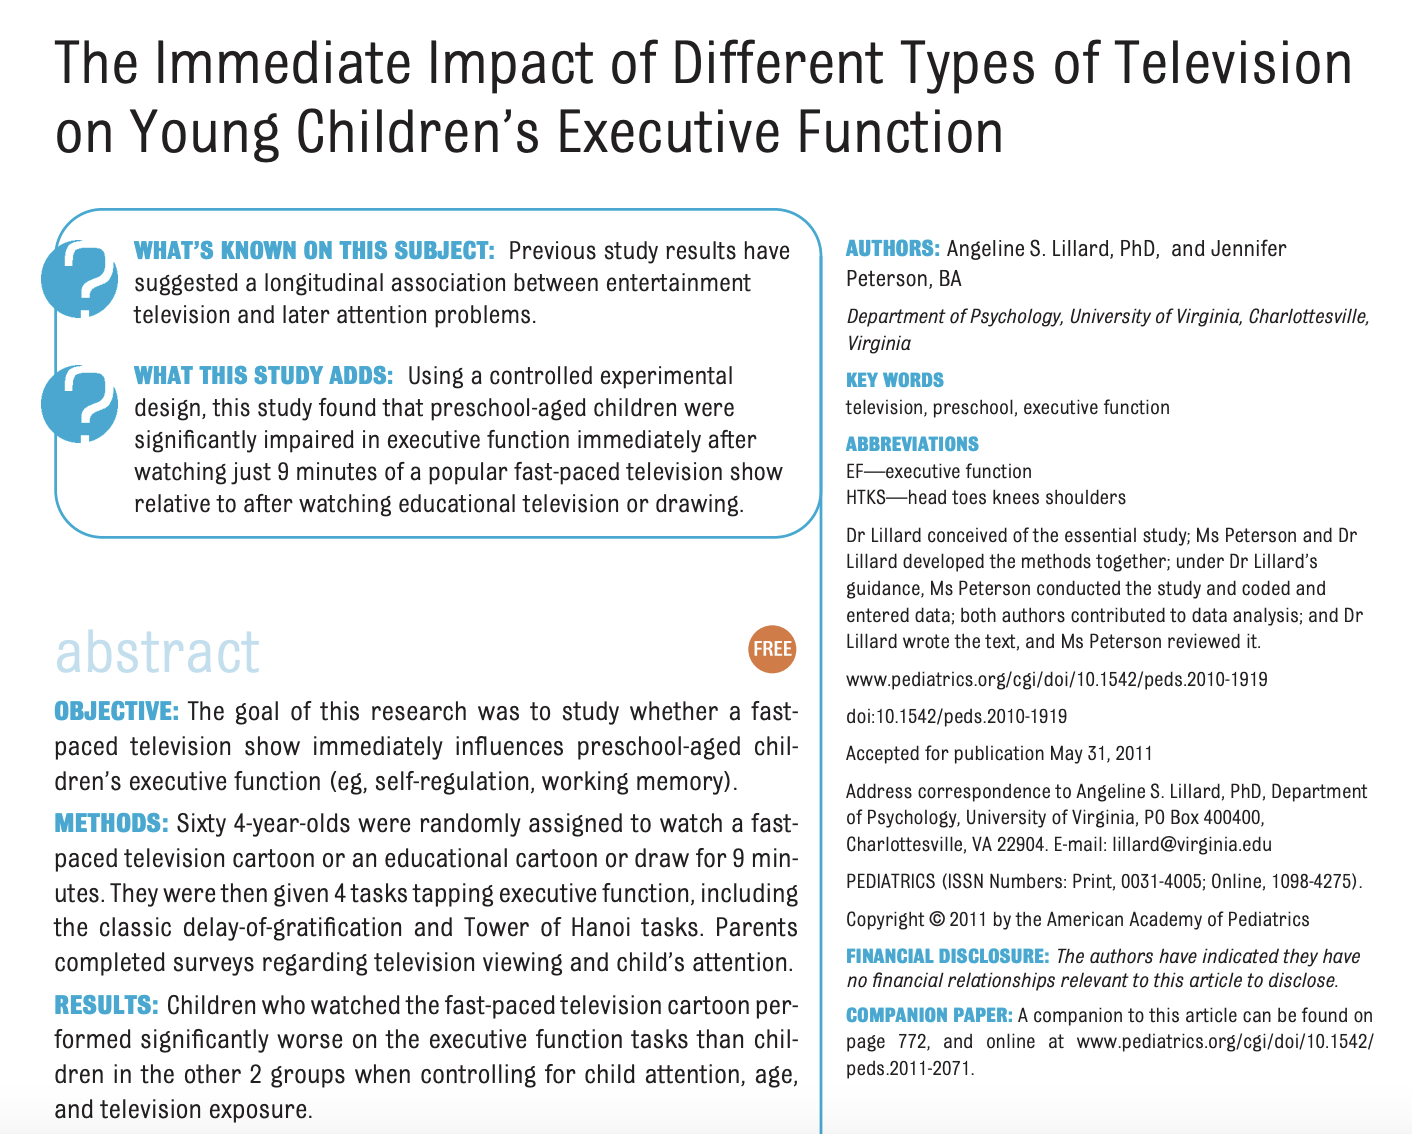
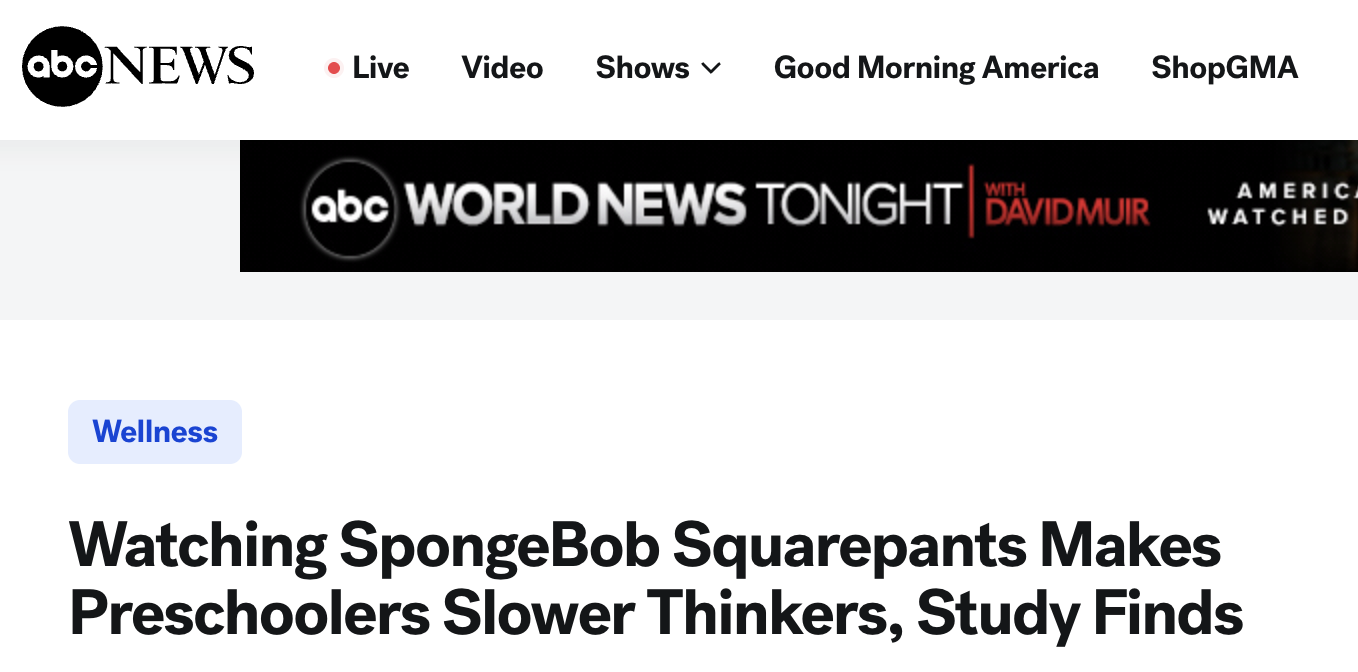
What did the study actually do?
Yet…
GitHub
![]()